


We have continued to crunch data from the South Shore and Cape Cod Association of Realtors® Multiple Listing Services (MLS) to help our clients and community better understand the impact of COVID-19 on our local market.
Last updated 9/14/20
This report is for single family homes in Plymouth County and Barnstable County. Please note Condos, Multi-family homes and land are excluded.
New Listings: New listings inventory continues to decrease vs last year. Down 16.53% from this time last year. In 2019 - 1,580 listings were available in Plymouth County as of 9/14/19 whereas there are only 619 homes on the market as of today. There was a large decrease of 9.3% in the number of new listings in Barnstable County year-to-date.
Price Changes: It is certainly still a Sellers market. They are still not negotiating in the current market and are getting more money for their homes than they would have at this time last year. 47.58% less Seller's have adjusted their asking prices this year versus 2019. Price change data is currently unavailable for Barnstable County.
Pending Contracts: As of September 14th, there has continued to be a decrease in the number of pending sales of 0.55% from what the numbers were in 2019. However, average days on market has also decreased as demand remains high in the current market. Pending data is currently unavailable for Barnstable County.
Closed Sales: A strong start of 2020 has helped sold data remain rather unscathed throughout the hardest months of the pandemic . The market has continued to be extremely active since mid-May although there has been a further decrease in closed sales by 269 homes year over year in Plymouth County due to the lack of inventory. Many homeowners know that they have a significant amount of equity in their homes and are choosing to stay put. In Barnstable County, a very slight increase of 6.2% more sales year over year as of September 14th shows that the market on the Upper Care is performing better this year than in 2019.
Mortgages: Mortgage rates continue to remain consistent over the last month and continues to do so as we enter into August with a strong real estate market. Readily available mortgage types continue to be Conventional (Fannie Mae and Freddie Mac), Government (FHA and VA with tighter FICO score requirements), USDA, Mass Housing, Renovation and Jumbo (although some lenders don't have access to some of the bank investors that are doing them). First time home buyer rates are low right now and it's a great time to take advantage!
We are here to help: We are here for you to answer any questions and help you find solutions and possibilities during these uncertain, changing times. Please do not hesitate to contact us at [email protected] or call 508-746-0033.
How is the Market performing right now?
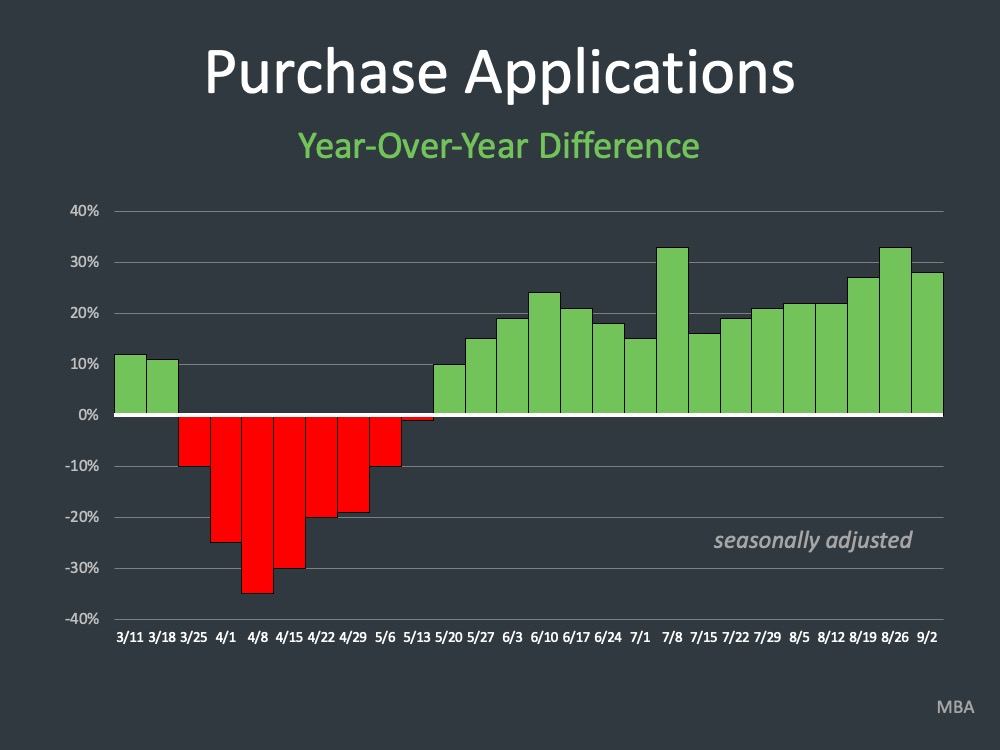
If we look at purchase applications year over year, we see we started out the year strong, that’s the first part of March, and
then it dipped down during the time when people couldn’t get out of their homes. And then since about the
middle of May saw year over year increase in purchase applications, more applications this year than
last week by week. And where do we stand right now? We are ahead year over year as yo can see in the graph to the left.
Now, it’s very good information and very good things to see for the health of the market, and real estate
certainly being very strong.
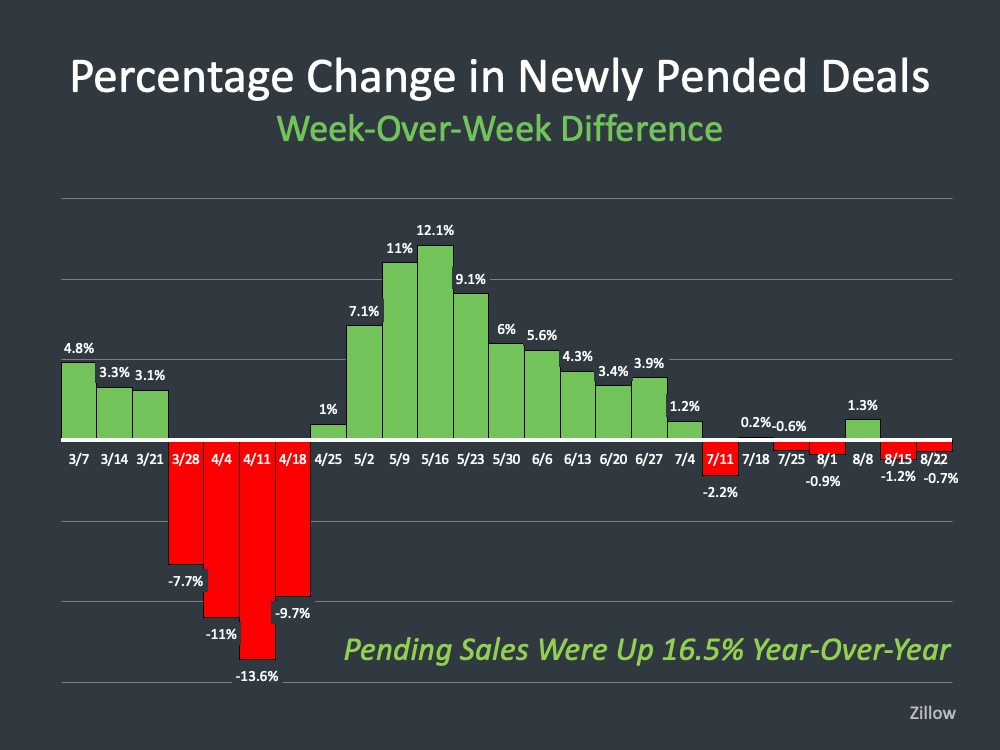
Now if you take a look at this next graph, we're looking at year over year pending deals by week. So, this is the change in newly pended deals. And again, if we start left to right and we see in March we were strong, dipped down during quarantine, and then during the summer folks begin coming out of quarantine and were able to go into contract on a home, again, suggesting there was a lot of pent-up demand for people that couldn’t get out before. And then for the last five or six weeks we’ve been kind of going between a percent up or percent down, leveling out.
Pending sales were up 16.5% year-over-year.
Now, you can look across and see each region of the country, Northeast leading the way, but each area
of the country showing significant jump over the previous year in showings. So, suggestive to say
there’s a lot of demand right now.
We’ve talked a lot about how home has become important, how
things are more important to people. Different things right now are important, whether it be
the needs you have in a home, the location you have in a home, other things like that, and we’re seeing
significant demand.

What is happening with Inventory and Pricing?
The challenge across the country is inventory and according to Danielle
Hale from realtor.com, most recently year over year total inventory was down 38%. Buyers
continue to be motivated by a low mortgage rate and the strong desire for certainty of ownership in an
uncertain world. They’re quickly putting offers on homes that come up for sale, driving the overall
number of homes for sale lower.
So, we know we’ve got a lot of demand there. We know we are limited
in the number of homes for sale and the overall supply of homes. This is an economic situation. If we start to
look at prices as this price scenario right now across the country is driven by high demand and low
supply, keeping upward pressure on prices.
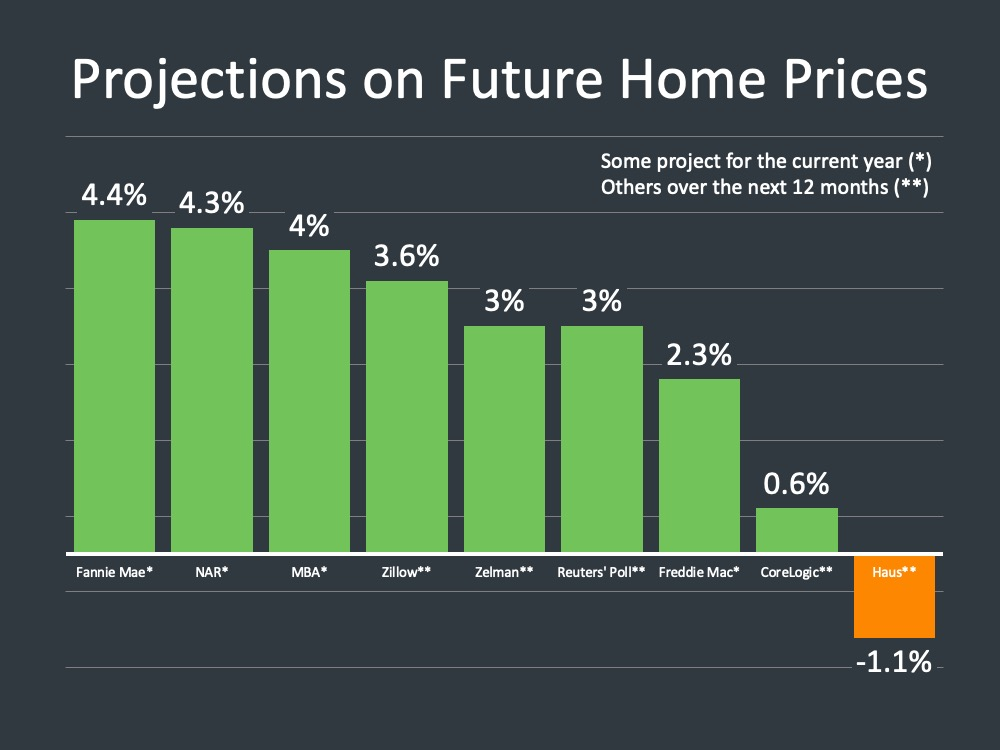
Here is a look at what experts are forecasting for pricing going forward in the next 12
months, and you can see the overwhelming majority, eight of the nine surveyed here are saying positive
price appreciation as we look forward. Some are projecting for this current year, some over the next 12
months, but as you look at that you see anywhere from the range of 3% to 4%.
A couple of outliers
there. Haus still saying negative 1 percent, but overwhelmingly people are saying we’re going to see
appreciation going into the remainder of this year and to next year. Again, governed and dictated by
supply and by demand, the lack of supply and the overwhelming demand.
Coming through all of this, housing remains very, very
good, and certainly is one of the factors economically helping to lead the way coming out of all of the
economic stress of the health crisis that we faced as a nation.
So, good news here relative to the health of the housing market, where we stand with prices and
appreciation going forward. All of that being fueled by people saying we need a home. There are
different reasons we need one, and we’re more motivated today to go out and buy. And all of that being
fueled by low interest rates.
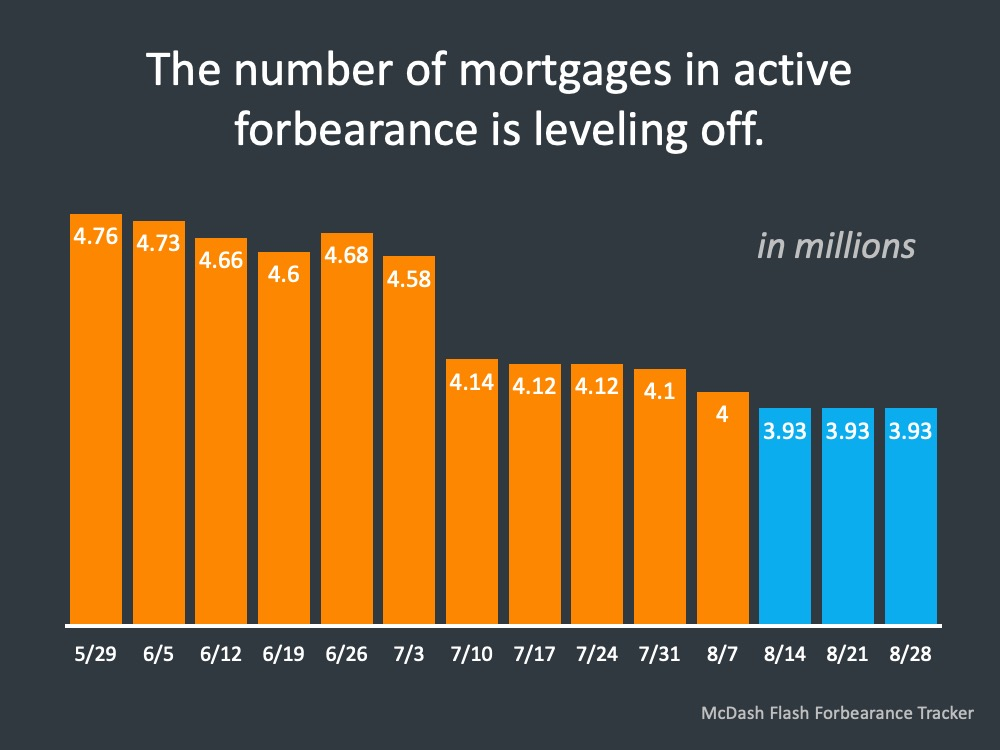
Now, there are some questions in the market that we're going to take a look at, the first being forbearance. Forbearance for the last three weeks has started to level off at 3.93 million. Right now as we look at it from July on in through August, we know that its dropped a little bit and now beginning to level off. The future question is - what’s going to happen
with those homes and those people that are coming out of forbearance? That’s the big question right
now.
So, Bank Rate’s Jeff Ostrowski, senior reporter, said this. “The COVID-19 pandemic will lead to a rise in mortgage defaults and foreclosures. But as the housing market muscles through this economic downturn it looks as if foreclosures will form a trickle rather than a flood, housing experts say.”
We’ve talked about the significant amount of equity that people have in
their homes today and that provides them options. We’re seeing that, his words here are a trickle rather
than a flood. So, there will be defaults in the country and certainly we don’t want to see that but that
happens in real estate, but nothing like what we saw in 2008 where there were very different scenarios
relative to the amount of equity, the financial stress that people felt, and the need to in some cases where
they owed more than the home was worth they just walked away and we saw this flood of foreclosures.
Let's go back to, “The COVID-19 pandemic will lead to a rise in
foreclosures.” Let’s address that and let’s say why is that? And here’s the simple answer for that; the percent of distressed property sales is at an all-time low right now. This gives you kind of a look
back to January 2012. And we know coming into the health crisis we were certainly low in the number
of distressed sales and we’re even lower now. Why? Because there is a moratorium on starting foreclosure proceedings, whether they’re judicial, non-judicial, proceedings, they literally can’t start and
as people extend their forbearance, that moratorium gets extended.
Let's talk about Affordability and Recovery...
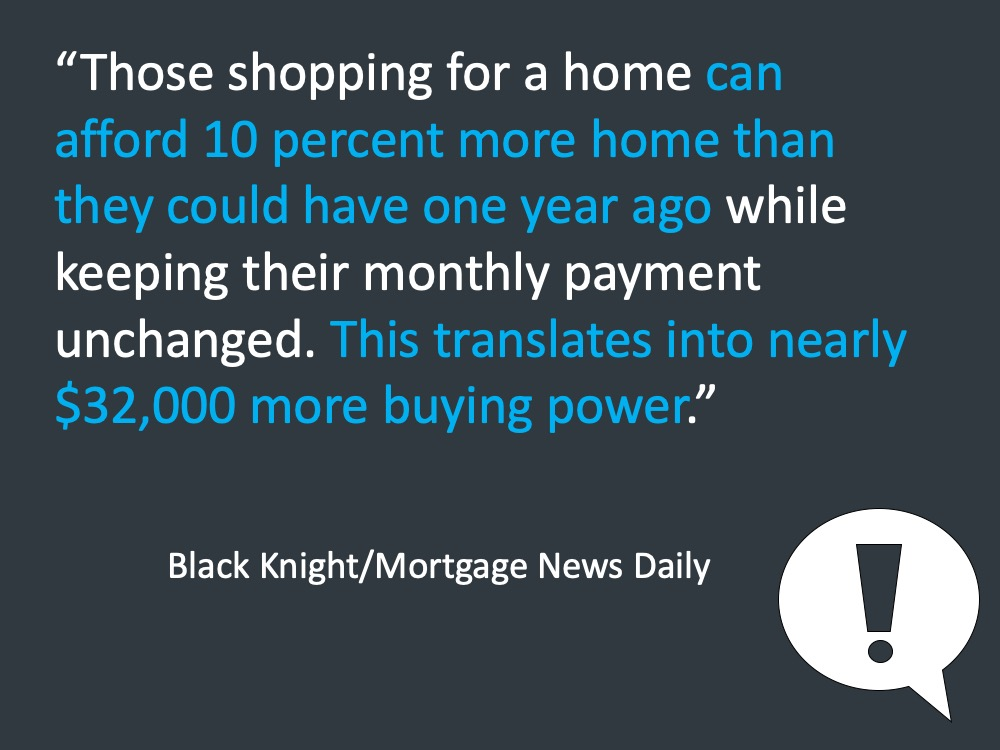
What we also need to be talking about in the market is affordability. As you read the quote to the right, it's important to think about and it's very interesting because $32,000 in more buying power is unreal across the country.
Back in November of 2018, almost two years ago, the average 30-year fixed was 4.94%.. Today we
sit just below 3%.
As we start to look into the fall and even into next year, the strength of the housing market
is going to be the story that’s out there. What we just saw earlier a lot
of this pent-up demand work through. However, we are seeing some early signs of shift or buying
preference to locate to lower density areas, potentially driving some additional purchase activity.
So, a lot of data to support right now people are moving from dense areas to less dense areas, urban
markets to suburban markets. They’re looking for a backyard, they’re looking for an office, they’re
looking for a place for their kids to do school in. There’s just different needs today in a home and that’s
certainly driving a lot of the demand that we’re seeing.
So, as we head into fall we’re up again as we looked at that, year over year. Starting to level out there, but strong, strong demand driven by a lot of need in the market. And this is a time right now where home has become more important to people in such a short amount of time than I’ve ever seen before, and the needs that people have, have increased dramatically.

LET'S TAKE A CLOSER LOOK AT HOW YOUR TOWN DID IN THE MONTH OF AUGUST ⤵️
In the Town of Plymouth, home sales have remained consistent from July through August. The number of Average Days on Market has continued to drop in the month of August from 61 in July.
Homes continue entering the market at a steady pace.

In the Town of Hingham, the number of new homes entering the market has decreased by nearly half since July. Home were selling much faster in August vs. July which can likely be attributed to low inventory. The Average Sale Price remains in the million dollar bracket month over month.

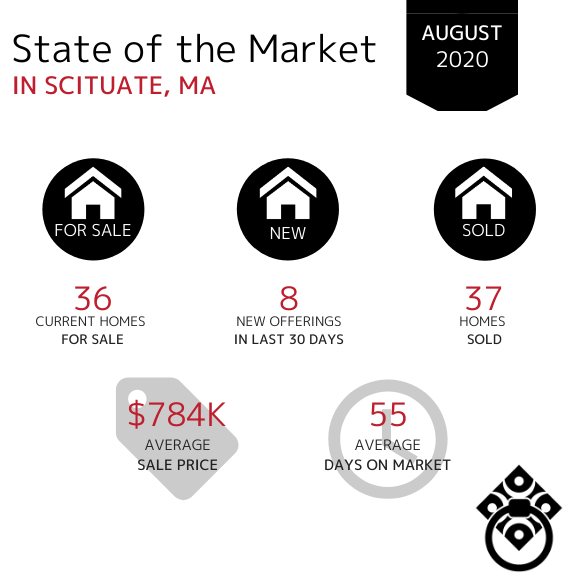
In the Town of Scituate, the Average Sale Price increased by just about $50,000 in August. Home sales have slowed down slightly but are remaining on the market in just under 2 months. The number of new offerings has decreased again which tells us that the market in the town of Scituate is remaining but at a much slower pace than neighboring towns.
In the Town of Marshfield, the number of homes sold during the month of July increased from 33 in July. Properties are selling at a slightly faster pace - at about a month and a half.

In the Town of Kingston, the number of new homes for sale has remained consistent but low from June through August. The number of homes sold increased which shows us that although there isn't much inventory available, buyers are still actively purchase those homes that do become available. The Average Days on Market decreased from 55 in July and the Average Sale price decreased as well from $534k in July.

In the Town of Duxbury, the Average Sale Price of homes increased from $845k in July into the million dollar bracket in August. Available inventory has remained the same month over month and the Average Days on Market increased from 55 in July.

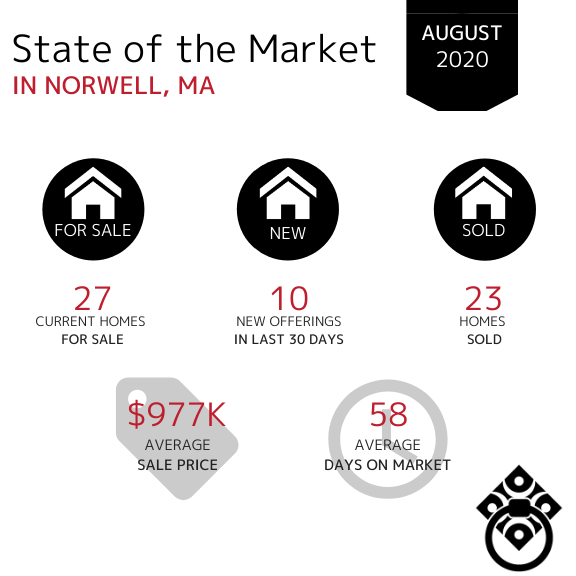
In the Town of Norwell, the average days on market have remained the same from July through August. There has been a consist amount of inventory from April through August. More homes sold in Norwell in the month of August vs. July and the Average Sale Price has increased from $790K in July to just under $1M in August.
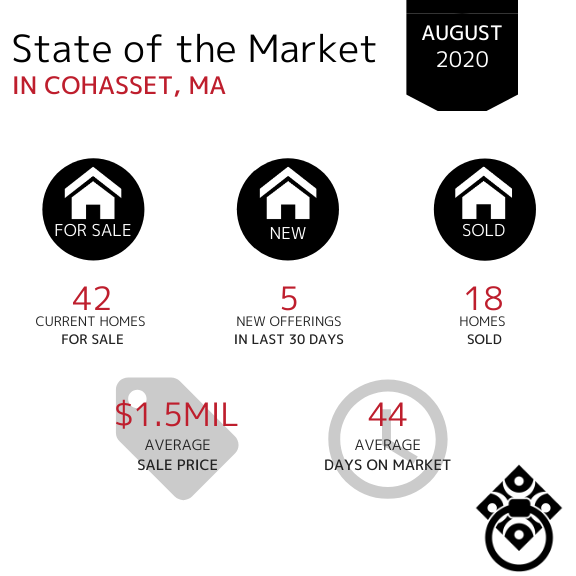
In the Town of Cohasset, the amount of available inventory has slightly increased as we ended the month of August and entered into September. The number of days on market has finally decreased from 76 in July to 44 in August. This is the first decrease since May. The Average Sale Price remains in the million dollar bracket but has decreased from $1.7M to $1.5M.
In the Town of Hanover, the number of homes sold has continued to increase month over month. The Average Days on Market has decreased from 62 days in July to 43 in August. The Average Sale price has increased from $598K in July.

In the Town of Pembroke, the amount of new offerings in the last 30 days have increased however the total amount of homes for sale has remained consistent which indicates that homes are still selling and entering the market simultaneously. The Average Days on Market significantly decreased from 80 days in July to under 2 months in August. The Average Sale Price has remained consistent in the mid-high $400,000s over the last five months.

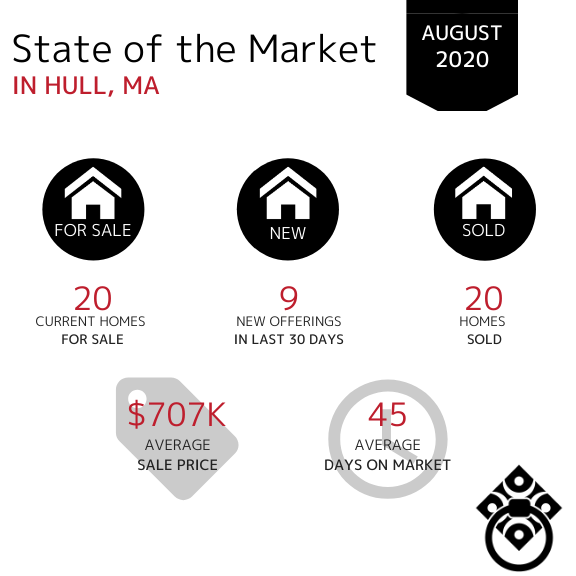
In the Town of Hull, the number of homes sold has increased from 14 in July to 20 in August. There were more homes entering into the market during the month of August than July and the Average Days on Market decreased from over 2 months to just 45 days in August. The Average Sale Price has increased from $586K in July to over $700K in the month of August.
In the Town of Bourne, the amount of available inventory has decreased slightly in August. The Average Days on Market decreased from 85 in July. Once again, this tells us that the buyer demand is there however the lack of inventory is hindering them buying at an even faster pace. The Average Sale Price has increased from $542K in July.

In the Town of Sandwich, the Average Days on Market significantly decreased from over 3 months in July to just 69 Days in August. The number of homes sold has decreased from 55 homes in July. The amount of new inventory in the last 30 days has remained consistent over the last 4 months!

In the Town of Mashpee, the Average Sale Price has remained fairly consistent over the last 2 months remaining in the mid-$800,000s. The Average Days on Market have decreased from July (91). The number of homes sold has remained consistent through July and August.

In the Town of Falmouth, the Average Sale Price has increased from $639k in July. The number of new homes entering the market in August increased from 59 in July which shows us that homeowners are still actively entering the market as summer comes to a close. The number of homes sold has remained consistent in July and August.

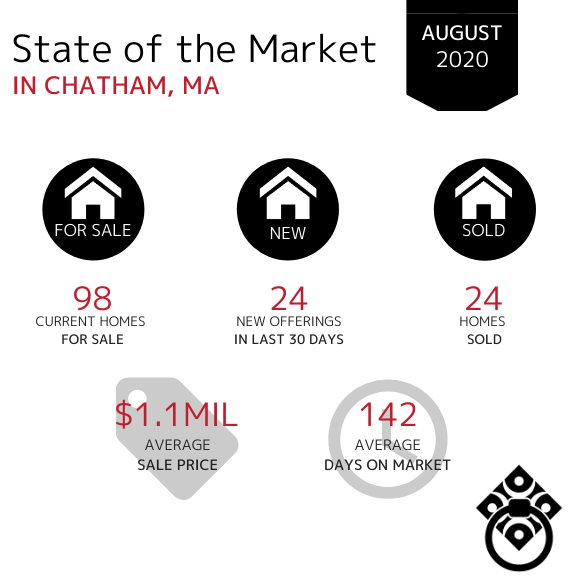
In the Town of Chatham, home sales decreased by half from July through August. This shows us that the market in Chatham is slowing down as summer comes to an end. The Average Sale Price has remained in the million dollar bracket as we ended August. The Average Days on Market decreased slightly from 181 in July vs. 142 days in August.
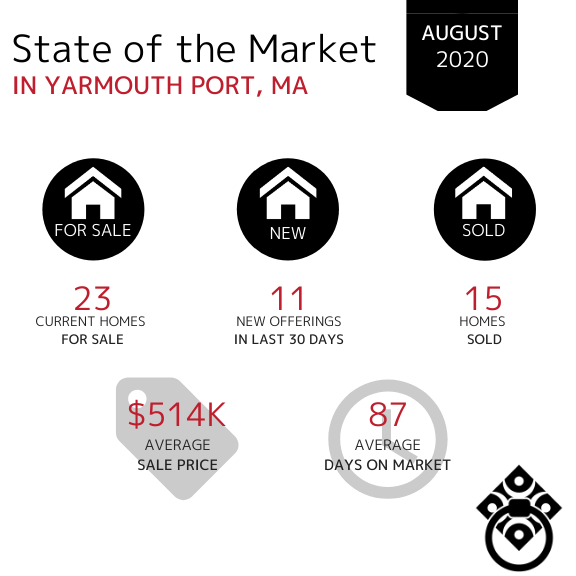
In the Town of Yarmouth Port, property sales have decreased slightly from 19 homes sold in July. The Average Days on Market remain consistent as well as the number of new offers and current homes for sale.
If your town wasn't included in this report,
click here and let us know. We'll be happy to get you that data!
VIRTUAL SELLING
SOLD DURING COVID-19
Looking for your Dream Home?
*Market Information obtained from MLSpin, Cape and Islands MLS and Keeping Current Matters*


