.png)
We like to keep you informed of the local real estate market to ensure you're well prepared when you need to make the decision whether or not now is a good time to buy or sell your home.
Below is a list that we've put together of the local South Shore and Cape Cod market reports for August 2018 ⤵️

In the town of Hingham, the number of homes sold in August remains that same from 2017 to 2018. Homes slightly increased in the average Days on Market from 52 in 2017 to 60 in 2018. The average sale price also saw a $30,000 increase in 2018.

In the town of Plymouth, year over year the numbers have stayed relatively similar. There was an increase in Average Sale Price and a decrease in number of Days on Market Which tells us that the inventory wasn't lasting as long this year as it was in 2017.

In the town of Scituate, homes sold at a faster rate at an average of 40 Days on Market vs. 71 Days on Market in 2017. The average sales price remains very similar with only a $40,000 difference.
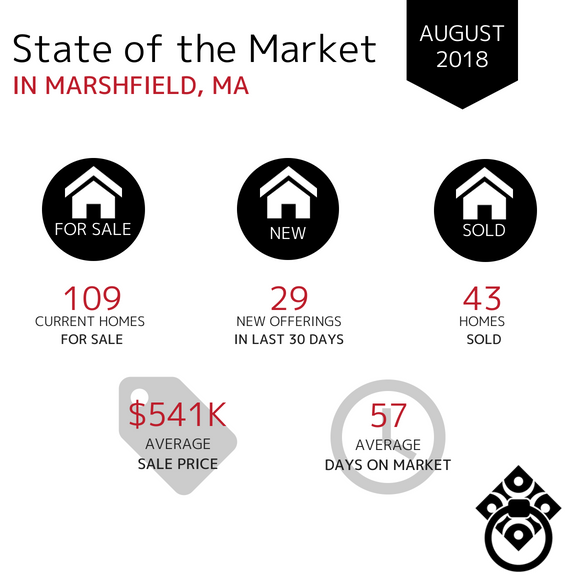
In the town of Marshfield, sales stayed consistent year over year in August. The only significant variance was the pace of sales. The average Days on Market decreased by 34% from 2017 to 2018 which shows us that inventory was moving at a faster pace in 2018 and buyers were out in full force ready to take on the available inventory.

In the town of Kingston, home sales dropped by half in the month of August. 2017 saw a stronger sales rate than 2018 however the average Days on Market and Sales Price remained almost identical year over year.

In the town of Duxbury, the number of homes sales only saw a slight increase in 2018 vs. 2017. The Average Sale Price decreased in 2018 by nearly $140,000. Inventory did move at a quicker pace in 2018 at 45 Average Days on Market vs. 63 Average Days on Market in 2017.

In the town of Norwell, the August 2018 market stayed consistent in comparison to 2017. Number of Homes Sold and Average Days on Market were consistent while the Average Sale Price decreased by $39,000.
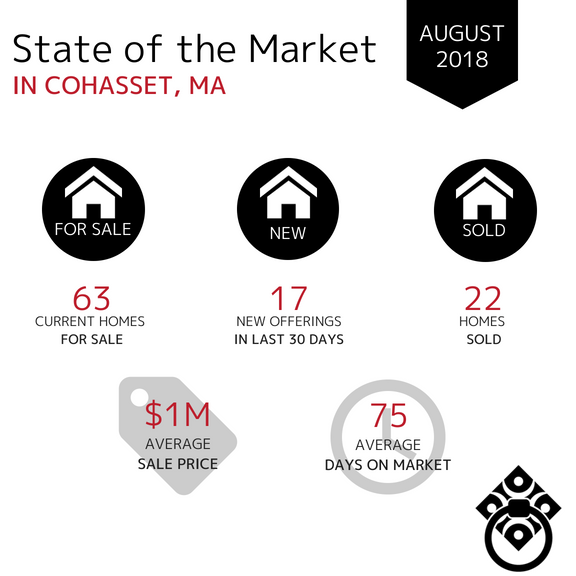
In the town of Cohasset, the biggest change in 2018 was the decrease in Average Days on Market. In 2018 the average was 75 days versus 2017 at 175 which shows that inventory was moving much faster in 2018. Again, this tells us that Buyers are ready NOW!
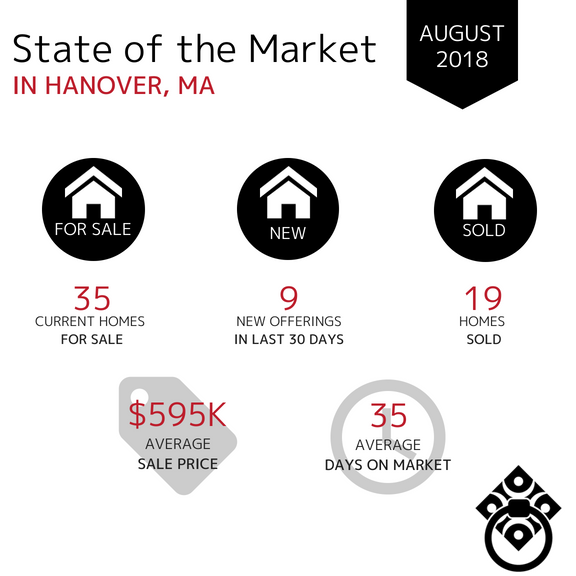
In the town of Hanover, the market stayed consistent with 19 homes sold in the month of August in 2017 and 2018. Although the same number of homes were sold, the time spent on the market was drastically different. 2018 showed inventory moving faster at an average of 35 Days on Market while 2017 had and average of 96 Days on Market.

In the town of Sandwich, 2017 and 2018 were very similar. There was a slight increase in Average Days on Market in 2018 as well as an increase in Average Sale Price. The number of homes sold varied by only 4 sales - with 31 sold in 2017 and 35 sold in 2018.

In the town of Mashpee, 25 homes were sold in the month of August in both 2017 & 2018. The Average Sale Price did decrease in 2018 by $138,000. The Average Days on Market stayed consistent with a slight increase from 80 to 98 in 2018.
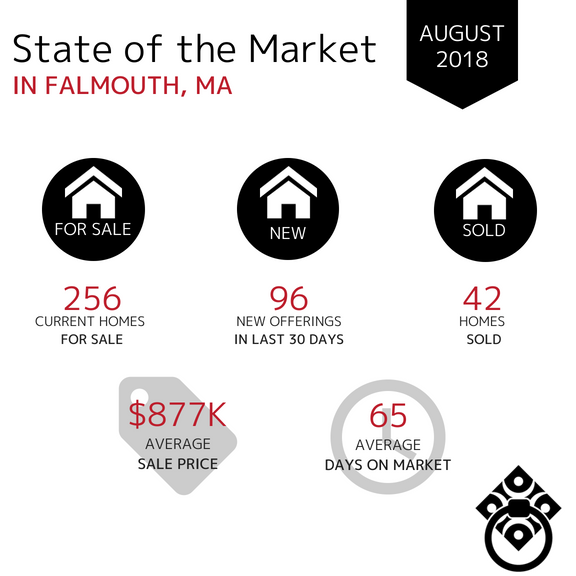
In the town of Falmouth, 42 homes were sold in 2018 vs. 49 in 2017 during the month of August. The Average Sale Price saw a significant increase from $599,000 in 2017 to $877,000 in 2018 which shows the increase in property value year over year. Additionally, there was a decrease of 37% for the Average Days on Market. Homes were selling much faster and at a higher price in 2018.
If there is another town that you would like to see the report for, click here and let us know!
Selling Your Home?
Get your home's value - our custom reports include accurate and up to date information.