
We have continued to crunch data from the South Shore and Cape Cod Association of Realtors® Multiple Listing Services (MLS) to help our clients and community better understand the impact of COVID-19 on our local market.
Last updated 8/12/20
This report is for single family homes in Plymouth County and Barnstable County. Please note Condos, Multi-family homes and land are excluded.
New Listings: New listings inventory continues to decrease year over year. Down 57.03% from this time last year. In 2019 - 1,522 listings were available in Plymouth County as of 8/12/19 whereas there are only 654 homes on the market as of today. There was a large decrease of 12.2% in the number of new listings in Barnstable County year-to-date.
Price Changes: It is certainly still a Sellers market. They are still not negotiating in the current market. 43.72% less Seller's have adjusted their asking prices this year versus 2019. Price change data is currently unavailable for Barnstable County.
Pending Contracts: As of August 12th, there has continued to be a decrease in the number of pending sales of 2.19% from what the numbers were in 2019. However, average days on market has also decreased as demand remains high in the current market. Pending data is currently unavailable for Barnstable County.
Closed Sales: A strong start of 2020 has helped sold data remain rather unscathed throughout the hardest months of the pandemic . The market has continued to be extremely active since mid-May although there has been a further decrease in closed sales by 364 homes year over year in Plymouth County. This is partially due to the lack of inventory we're experiencing. In Barnstable County, a very slight increase of 0.7% more sales year over year as of August 12th shows that the market on the Upper Care was fairly similar to the market in 2019 at this time.
Mortgages: Mortgage rates continue to remain consistent over the last month and continues to do so as we enter into August with a strong real estate market. Readily available mortgage types continue to be Conventional (Fannie Mae and Freddie Mac), Government (FHA and VA with tighter FICO score requirements), USDA, Mass Housing, Renovation and Jumbo (although some lenders don't have access to some of the bank investors that are doing them). First time home buyer rates are low right now and it's a great time to take advantage!
We are here to help: We are here for you to answer any questions and help you find solutions and possibilities during these uncertain, changing times. Please do not hesitate to contact us at [email protected] or call 508-746-0033.
When is the economy going to recover?
As we enter into August we're looking towards economic recovery that it is starting to
happen. Ultimately the strength of that is going to
depend on how well we contain and really manage COVID-19 going further. All of this
is going to depend on the treatments that are available, the vaccines are available, things that are in the
process. It's also going to be largely dependent on when those are available to people to use and people
feel more comfortable about being able to go out and safety interact with one another.

The interesting thing is as we think about the last several months and what’s happened with this
external health crisis and how it’s impacted our economy, is now we’re starting to get a look at what’s
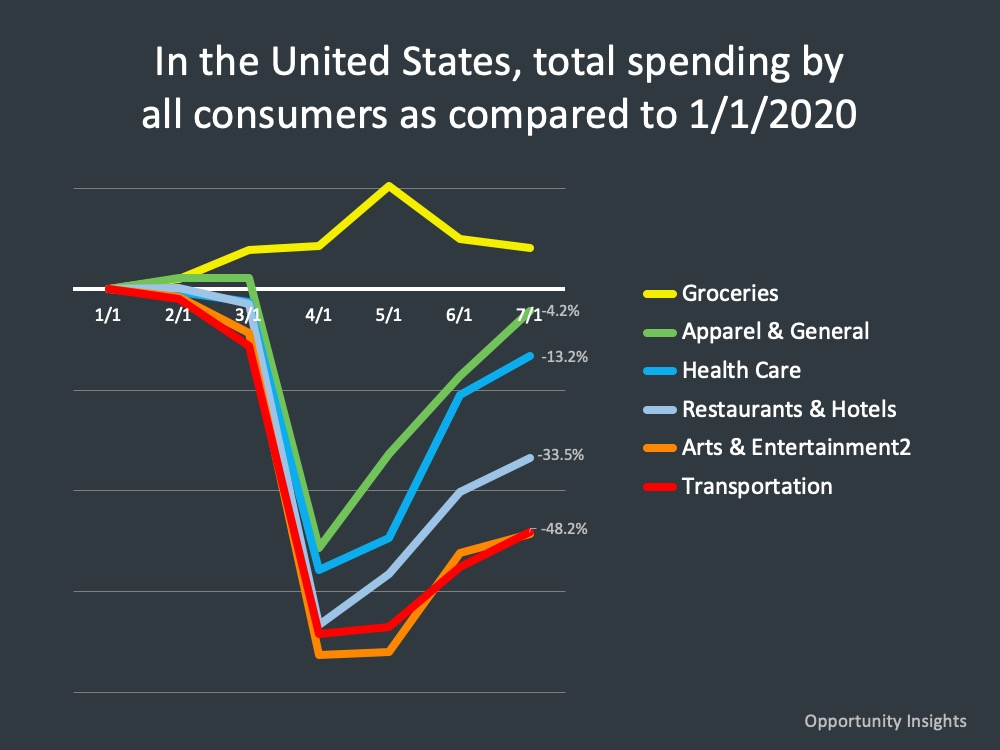
going on with consumers. Here is a look at consumer spending as
compared to January 1st. So, when we look at this you can see it there clearly, it’s a tale of different
industries. If you’re in the grocery business over the last several months with everybody eating at home
and people not being able to go out into restaurants and some of those in many, many states shut down
during the quarantine, the grocery business has grown during that time, but other businesses have fallen.
You see that deep fall at the end of March and into early April, but then hitting a
bottom and starting to come back up. What we’re looking at right now, economically speaking, is that it varies by the
different type of business.
Apparel and general business is starting to head back. Transportation, things
to do with travel, not as quickly. This will likely be the trend going forward; we'll see some businesses recover quicker than others.
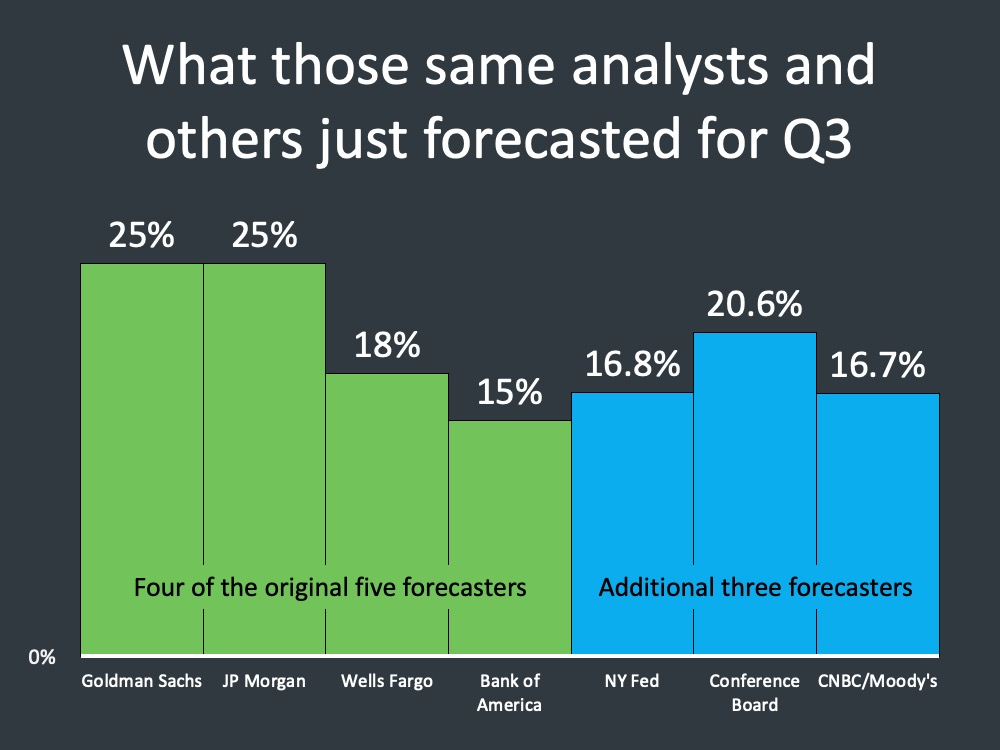
Now we’re in the third quarter but let's review a few things about the second quarter. In the second quarter the forecast that experts delivered, the average was right at 31, -31%, meaning the economy would constrict by 31%. Now what actually happened is the economy constricted in the initial advanced estimate by 32.9%. Very close to what the experts said would happen in the second quarter.
If we’re going to look at what those experts said then, we have to look at what they’re saying right now. It’s encouraging relative to economic recovery. Those same analysts just forecasted anywhere from 15 to 25% economic recovery over the last quarter of the second quarter as we go forward. So, we’re starting to see economic recovery happen, and there are a lot of questions going into the fall.
What is happening with the Housing Market?
Statements from many experts are very intriguing, summing up that where the housing market
is right now is blowing away what the experts have thought, and really underscoring the strength of housing
right now, and the importance of housing.
“Despite the crippling and ongoing
coronavirus pandemic, millions out of work, a recession, a national reckoning over systemic racism, and
a highly contentious presidential election just around the corner (we’ve got to remember that), the
residential real estate market is staging an astonishing rebound.” - Realtor.com

So, we’re seeing housing play a critical role. We've followed ShowingTime since the start of this because that data is going to give us that leading indicator of people going out and looking at houses.
You can see here the number of weeks since around the middle of May that we’ve seen weekly showings be up has normalized back to January. This dipped down in late March and April but coming back, and people going out and looking at houses. The reasons people had for looking for a home have changed or have grown, or become greater during this time.
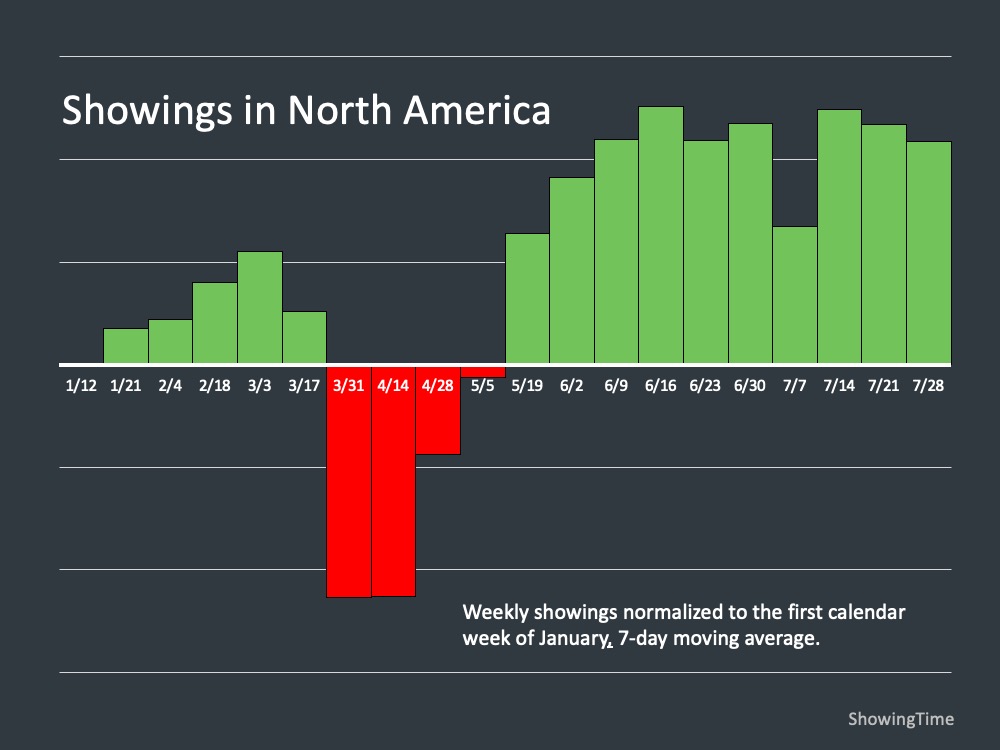
A lot of that is filled with pent up demand. As we go into the fall we’re going to start to see that normalize out a little bit. The showings and the activity out in the market is very, very strong.
Coming from Ivy Zelman, she says: “Whether in terms of pending contract activity or our proprietary buyer demand ratings, the various measures of demand captured in this month’s survey can only be described as shockingly strong, in spite of the resurgence of COVID-19 cases.”
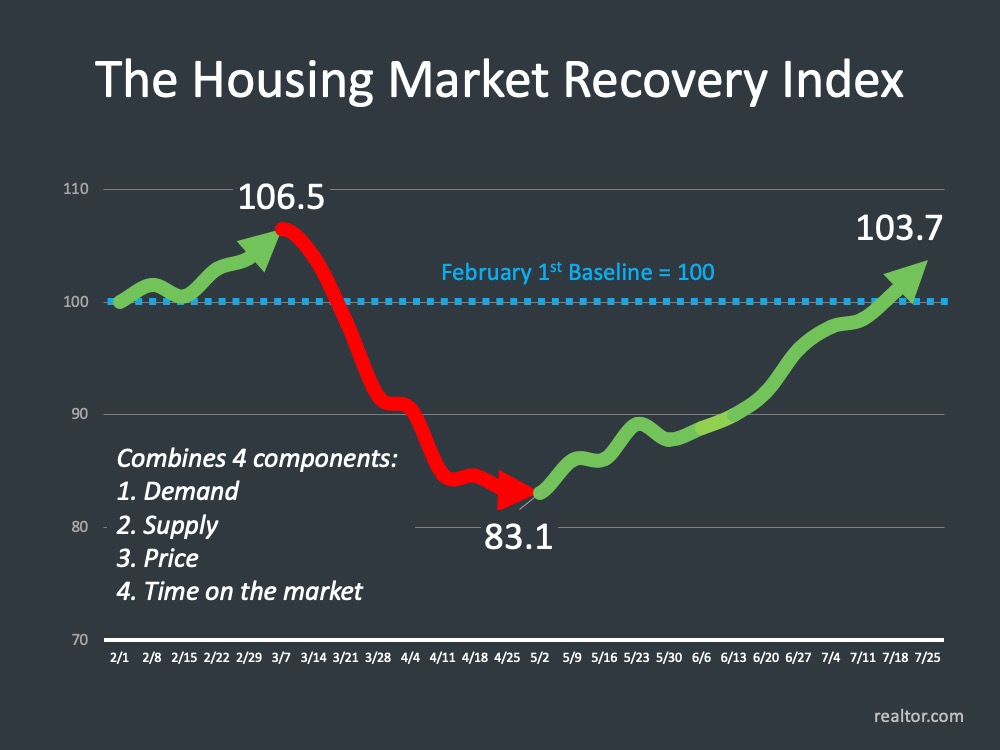
So, we’re seeing that come back. We’ve looked very often at the NAR housing market recovery index. That index takes demand, supply, price, and time on market, combines those together and creates this index. You can see the dip down and rise back up here and we’re now at a point that is above the February 1st baseline. Certainly not cumulatively in this year. We’re not ahead of where we would have been had we not gone through the pandemic, but that index is now saying we are recovering strong in that aspect.
The question that starts to come up that is on a lot of people’s minds, is what’s going to happen to prices. Many have talked about
experts that have said we may see price deprecation during this time.
Quicken Loans came out and
said: “The pandemic has not stopped the consistent home price growth we have witnessed in recent
years.”
This is indicative of the recovery and coming through that. We’ve seen
housing become increasingly more important through this pandemic. More important to people, the needs
become more important in driving that demand.
Now there’s a large range of projections on what’s happening with housing prices. This is a collection here of nine experts and what they’re saying about housing prices. Anywhere
from 4.4% appreciation all the way to the very right to about 1% depreciation.
This gives you a look at what most are calling for, seven out of these nine
are calling for positive appreciation going in the next 12 months.

If we want to look at the other side of demand, move.com tells us this: “The summer home buying season is off to a roaring start. As buyers flooded into the market, the realtor.com monthly traffic hit an all-time high of 86 million unique users in the month of June 2020, breaking May’s record of 85 million unique users.” So, the month before was 85 million, June is 86 million. We are definitely seeing that in this current market. We’re seeing people say you know what, we now have different needs in the home that we need or we’re looking for. In some cases maybe less space and in some cases more space, in some cases we need a backyard, etc.
Now interestingly in that, the National Association of Home Builders has come out and said this: “Of American adults considering a future home purchase in the second quarter of 2020, about half (49%) are not simply planning it, they are actively engaged in the process to find a home. This is a significantly higher share than the comparable figure a year ago at 41%, which suggests that the COVID-19 crisis and its accompanying record low mortgage rates have converted some prospective buyers into active buyers.”
So, not only are things (housing) more important today, demand is being driven by low interest rates. People are making the decision to buy, sell or refinance because it makes more sense. We don’t know where that’s going to go. Interest rates are forecasted and projected to remain low, but as the economy improves we know that those will start to edge up. The gift of economic downturn is oftentimes lower interest rates, and we’re seeing that right now. But as the economy improves we should expect those interest rates to go up.
LET'S TAKE A CLOSER LOOK AT HOW YOUR TOWN DID IN THE MONTH OF JULY ⤵️
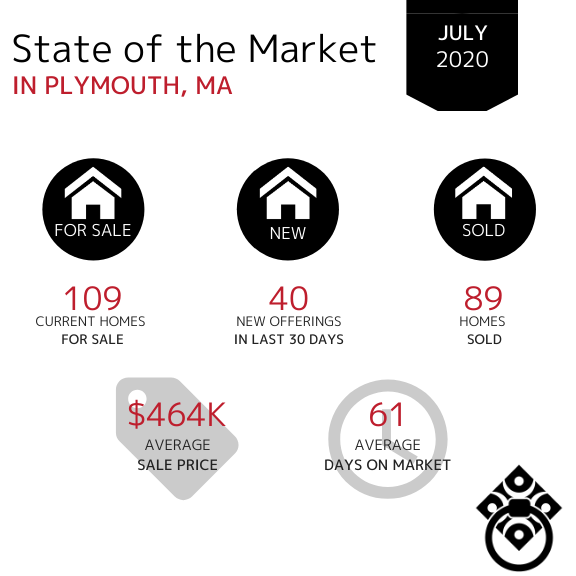
In the Town of Plymouth, home sales increased in the month of July. The number of Average Days on Market has dropped in the month of July from 88 in June.
Homes continue entering the market however the number of new offerings within the last 30 days has decreased.
In the Town of Hingham, the number of new homes entering the market has remained steady showing us that Sellers are continuing to place their homes on the market as homes are selling at a consistent pace. The Average Sale Price remains in the million dollar bracket and homes are selling at a slightly faster pace.

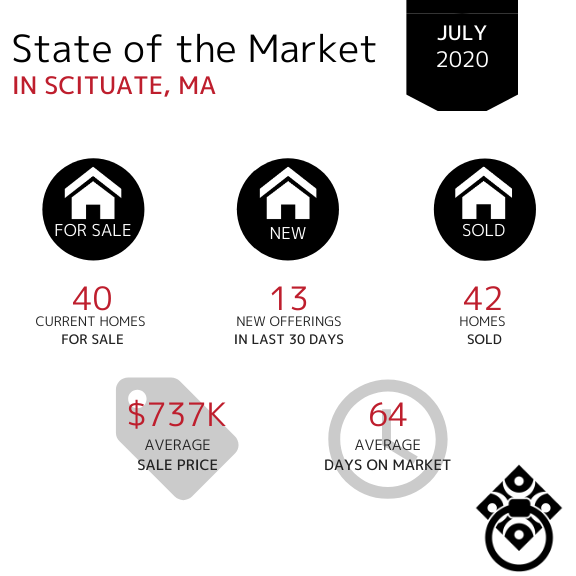
In the Town of Scituate, the Average Sale Price decreased again in the month of July. Home sales picked doubled in July however they are staying on the market for just over 2 months. The number of new offerings has decreased slightly which tells us that the town of Scituate is remaining an active market for both Buyers and Sellers.
In the Town of Marshfield, the number of homes sold during the month of July increased from 22 in June. Properties are selling at a consistent pace - just under 2 months.

In the Town of Kingston, the number of new homes for sale has remained consistent from June through July. The number of homes sold decreased showing which is likely due to the lack of overall inventory. The Average Days on Market remained consistent and the Average Sale price increased from $509k in June.

In the Town of Duxbury, the Average Sale Price of homes increased from $799k in June. Available inventory has continued to decrease month over month and the Average Days on Market decreased from 72 in June. This indicates that homes on the market are being purchased faster than last month.

In the Town of Norwell, the average days on market decreased from June at 74 to 59 in July. There has been a consist amount of inventory from April through July. More homes sold in Norwell in the month of July vs. June however the Average Sale Price has decreased from $837K in June.

In the Town of Cohasset, the amount of available inventory has slightly decreased as we ended the month of July and entered into August. The number of days on market has continued increased from May through July. Average Sale Price remains in the million dollar bracket but has risen from $1.1M to $1.7M.

In the Town of Hanover, the number of homes sold has increased from 13 in June to 20 in July. The Average Days on Market has remained consistent from June through July. The Average Sale price has decreased which shows that the market is slowing in Hanover.

In the Town of Pembroke, the amount of new offerings in the last 30 days have decreased however the total amount of homes for sale has remained consistent which indicates that homes are selling and entering the market simultaneously. The Average Days on Market significantly increased from just 1 month to nearly 3 months in July. The Average Sale Price has remained consistent in the mid-high $400,000s over the last five months.

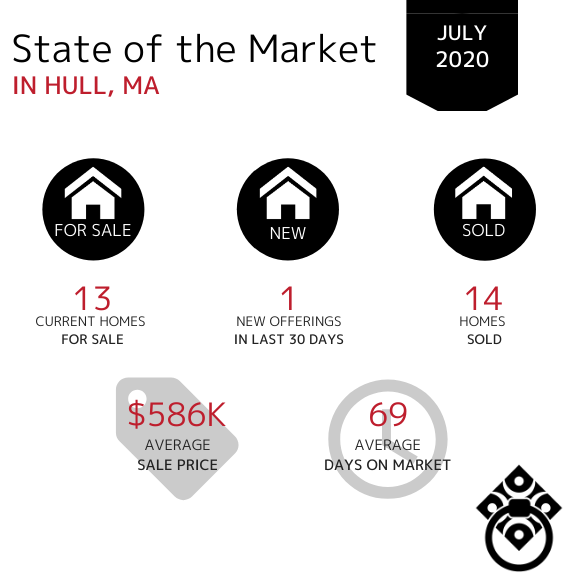
In the Town of Hull, the number of homes sold has increased from 4 in June to 14 in July. There is a lack of inventory however the Average Days of Market has decreased significantly.
The Average Sale Price has increased from $563K in June to $586K.
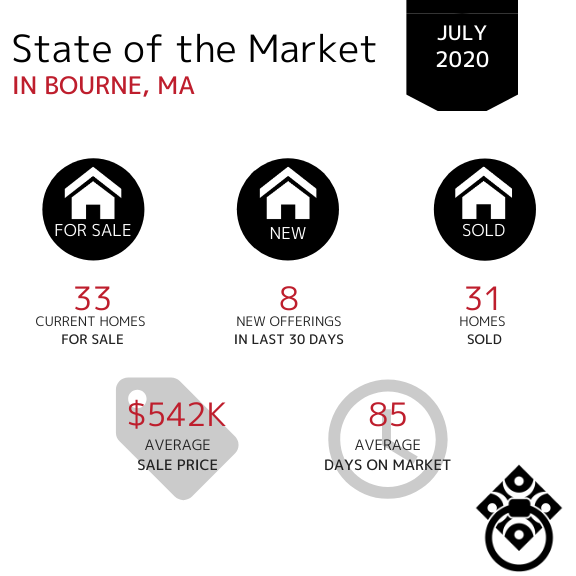
In the Town of Bourne, the amount of available inventory has decreased slightly in July. The Average Days on Market increased from 74 in June. Once again, this tells us that the buyer demand is there however the lack of inventory is hindering them buying at an even faster pace. The Average Sale Price has remained in the mid-$400k range.
In the Town of Sandwich, the Average Days on Market significantly increased from just over 2 months over 3 months in July. The number of homes sold has increased from 35 homes in June. The amount of new inventory in the last 30 days has remained consistent over the last 3 months!

In the Town of Mashpee, the Average Sale Price has significantly increased from $599k in June. The Average Days on Market have also increased from June (74). The number of homes sold has continued to increase through July.

In the Town of Falmouth, the Average Sale Price has remained consistent in the mid-$600s. The number of new homes entering the market in July decreased slightly however homeowners are still entering the market. The number of homes sold has increased from 47 in June.

In the Town of Chatham, home sales increased from May through July. (from 14 to 42). This indicates a strong market as we continue through summer in Chatham. The Average Sale Price has risen again to the million dollar threshold as July came to an end. The Average Days on Market increased from 116 in June vs. 181 days in July.

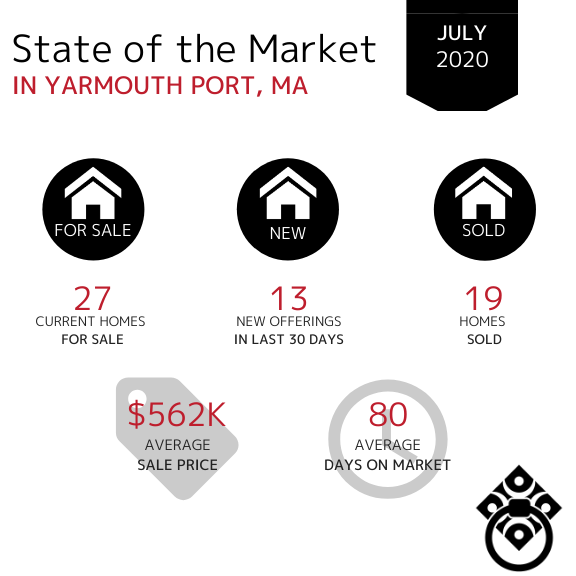
In the Town of Yarmouth Port, property sales have significantly increased from 6 homes sold in June to 19 sold in the month of July. The Average Days on Market have doubled since June however, there is still a lack of new inventory entering the market which could cause the average days on market to rise again.
If your town wasn't included in this report,
click here and let us know. We'll be happy to get you that data!
VIRTUAL SELLING
SOLD DURING COVID-19
Looking for your Dream Home?
*Market Information obtained from MLSpin, Cape and Islands MLS and Keeping Current Matters*