

We have continued to crunch data from the South Shore and Cape Cod Association of Realtors® Multiple Listing Services (MLS) to help our clients and community better understand the state of the local real estate market as we continue into 2021 and what is to come.
This report is for single family homes in Plymouth County and Barnstable County. Please note Condos, Multi-family homes and land are excluded.
New Listings: New listings inventory continues to remain down by 66% from this time last year. In 2020 - 889 listings were available in Plymouth County as of 3/10/20 whereas there are only 296 homes on the market as of today. There was a decrease of 42% in the number of new listings in Barnstable County as compared to 2020 (158 less homes available).
Price Changes: It continues to be a Sellers market due to limited inventory throughout Plymouth County. Sellers are still not in a market where they need to be negotiating and they're are getting more money for their homes than they would have at this time last year. 188 homes changed their prices last year vs. 65 YTD. Price change data is currently unavailable for Barnstable County.
Pending Contracts: As of March 10th, there are 17.7% less homes with sales pending compared to last year. The average days on market has continued to decrease as demand remains high in the current market. Pending data is currently unavailable for Barnstable County.
Closed Sales: The market has continued to be extremely active even with limited inventory. That has not stopped as we continue through the beginning of 2021 however with less inventory, there has been fewer sales vs 2020. As of March 10th home sales are down by 2.2% 2021 vs. 2020. The number of listings sold in Barnstable County is up 20% as of 3/10/21.
Mortgages: Mortgage rates have increased slightly for the first time since 2020 however they still remain lower than usual with a strong real estate market. Readily available mortgage types continue to be Conventional (Fannie Mae and Freddie Mac), Government (FHA and VA with tighter FICO score requirements), USDA, Mass Housing, Renovation and Jumbo (although some lenders don't have access to some of the bank investors that are doing them). First time home buyer rates remain low right now and many are finding that they are qualifying for Conventional Loans setting them at a better advantage for winning offers.
We are here to help: We are here for you to answer any questions and help you find solutions and possibilities during this insanely busy market that we are experiencing. Please do not hesitate to contact us at [email protected] or call 508-746-0033.
Mortgage Rates
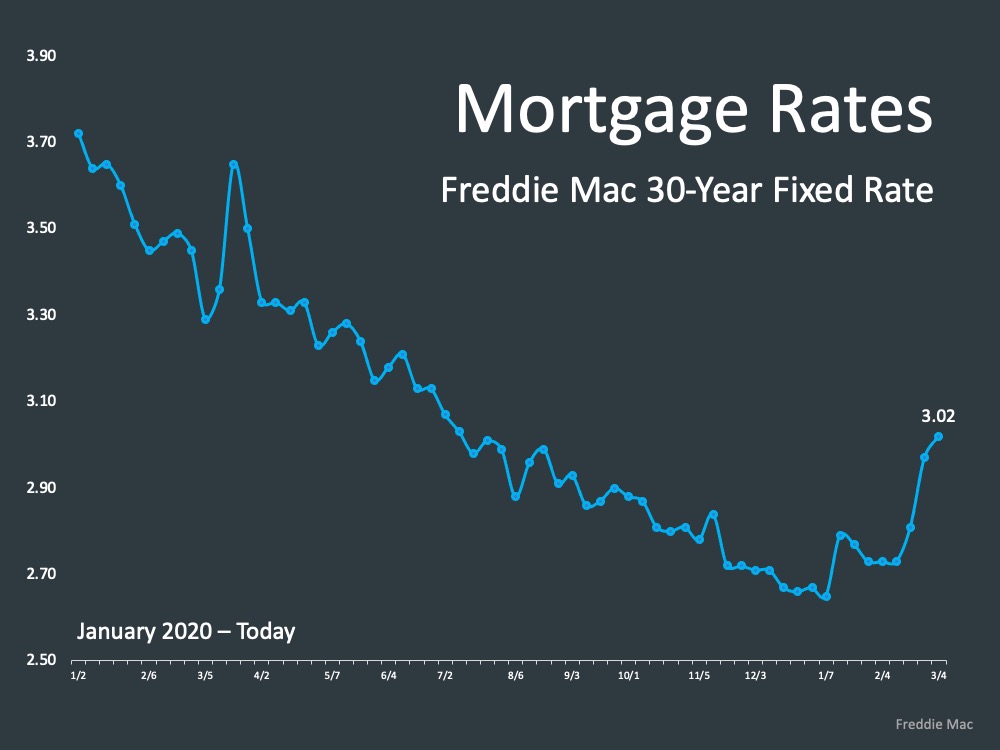
Have we seen the lowest already? We’re certainly seeing mortgage rates creep up here in the beginning of March, and we’ll see what the future holds but as of today, mortgage rates coming over, the average 30 year fixed, coming over 3%.
“Since reaching a low point in January, mortgage rates have risen by more than 30 basis points, and the impact on purchase demand has been noticeable.” Freddie Mac reports.
Cont... "Purchase activity remains high. It’s cooled over, off the last few weeks and it’s currently on par with early March prior to the pandemic. However, the rise in mortgage rates over the next couple of months is likely to be more muted in comparison to the last few weeks, and we expect a strong spring sales season."
So average 30 year fixed, 3.02% right now. And in the rearview mirror, Sam Khater here said you know, “What we’ve seen, rates start to tick up.” However they will likely be more muted as we go forward but no doubt the horizon is that interest rates are going to begin to rise as the economy improves, as we get better information on the coronavirus. If we look at this, this is kind of a snapshot here we’ve been using for the 30-year fixed rate going all the way back to the beginning of last year. January and February of last year, two of the best months in residential real estate in over 10 years.
We’ve been ahead of that this January and February, so a lot of demand, a lot of activity in the market, and now we’re starting to see those rates creep up. Interest rates in today’s market are going to be a question for a lot of people out there thinking about buying a home.
Forbearance
An update regarding forbearance - there have been a few articles that have come out asking, is forbearance going up? Is it going down? What’s happening?
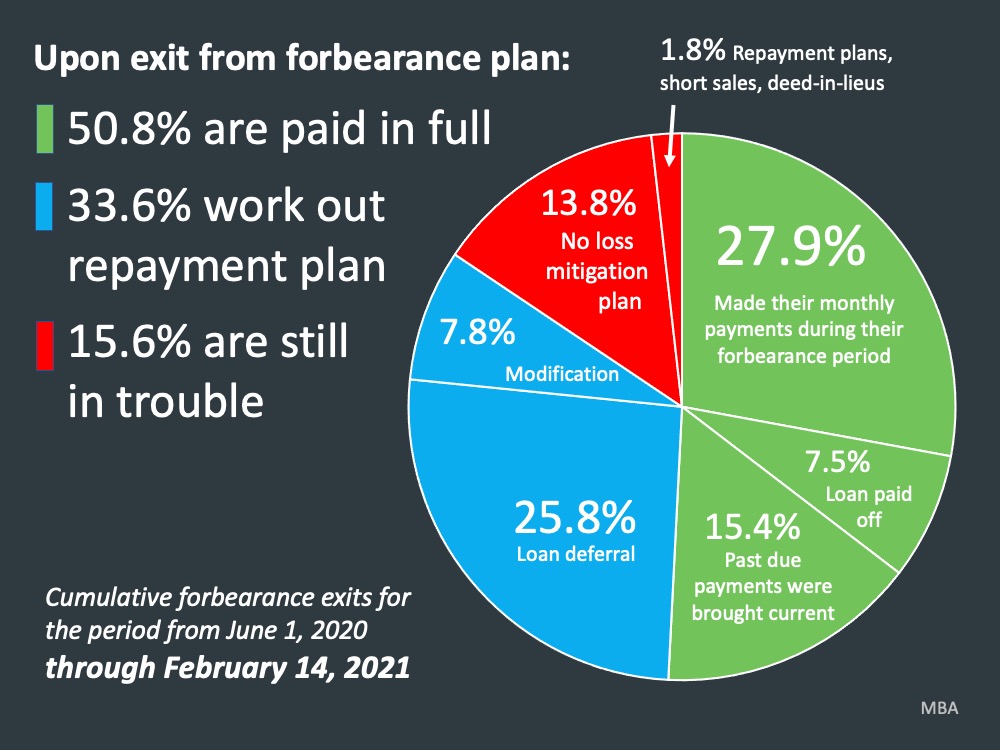
Those that are coming out of forbearance, we see largely are remaining the same. This data is as of February 14th. We see almost one out of two that took forbearance didn’t need it. You know, they made their monthly payments or they made them at the end, they paid off their loan, whatever the case may be. A significant portion, 33%, are in some kind of loan modification. They’re in a deferral. They tack the payments on the back end.
That’s 84% of the people that took forbearance got out of it. Why is that important? Well, the narrative on the front end of this was that all of these people are going to take forbearance, and they’re all going to turn into foreclosures. Simply not the case. We still have those in red, a little over 15% that are still in trouble, that don’t have a loss mitigation plan or are in some form of distress sale, deed in lieu, short sale, whatever the case may be.
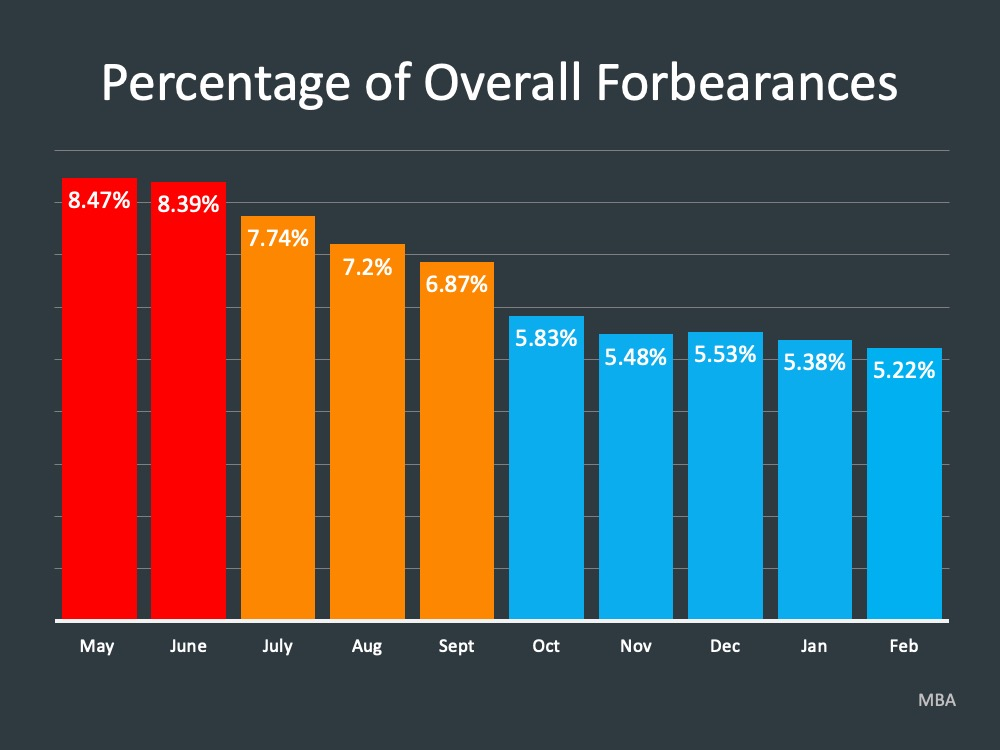
If we look at the percentage of overall forbearances, that has decreased. It kind of plateaued over the last couple of months, where we see a 5.22% of mortgages as of February in active forbearance. Slowly coming down, but you can see that they’re in the blue bars on this graph. And so while we start to see that come down, you know, as we go throughout the year, we’ll see more and more people come off of forbearance. Not everybody started it the same. No doubt over the next year, people will exit forbearance. That number will start to go down.
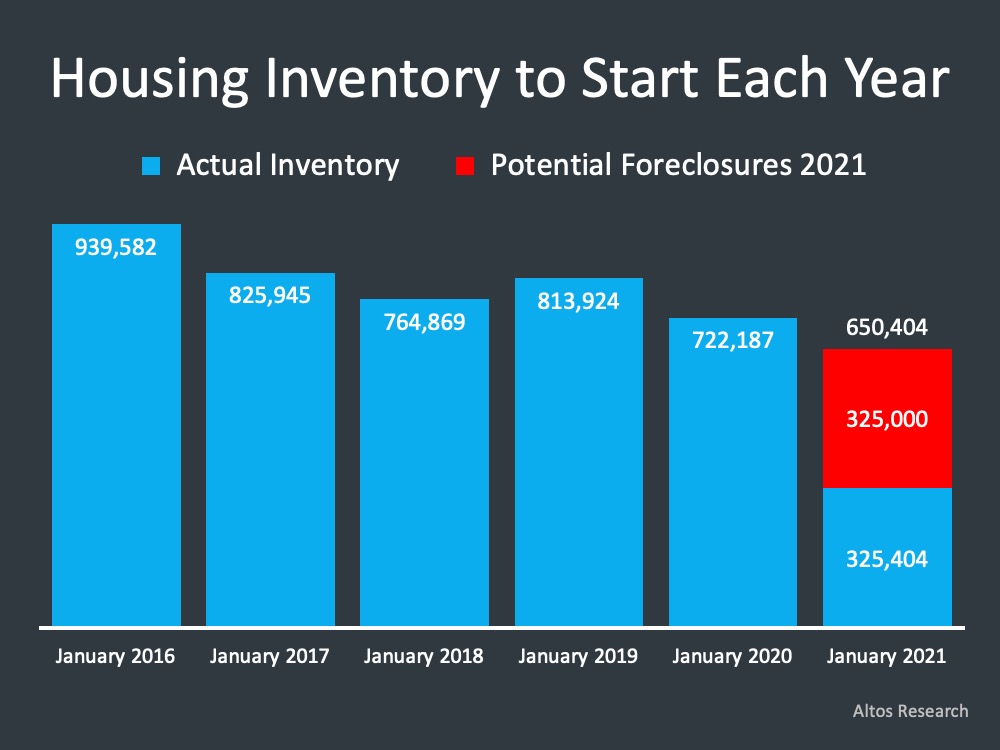
DS News reported this. “About 325,000 people will exit the forbearance program over the next 6-9 months without a plan in place. Some, but probably not all of those loans, will likely default.” Now, that brings up this question again. Are we going to see this rush of foreclosures?
325,000 people going into some type of distress sale. Now, we’re not saying all of those are. They’re saying some but not all. 325,000 families and individuals into perspective, I want to show you a picture, if all that inventory were to come to market today.
Inventory
This graphic gives you a perspective of how housing inventory started each year going all the way back to 2016. You see where it’s been, where we stand today, 325,000, just over 325,000 active inventory across the country. If all of those distress sales came to market tomorrow, which, again, nobody is calling for that - that wouldn’t even get us to where we were this time last year. Or any time, back to 2016. So, as far as the real estate market is concerned, there’s no way we see a foreclosure crisis coming.
The biggest issue no doubt that we face, and it’s highlighted by this graph here, is the lack of inventory.
Odeta Kushi from First American says this. “The lack of existing homes available for sale remains the only drag to housing market potential. Many homeowners may want to upgrade, but do not for fear that they will be unable to find a home to buy, preventing more supply from reaching the market and exacerbating the lack of inventory. As a result, everyone ‘stays put’ and the supply of homes for sale dwindles even further.”
This idea that we want to sell our home but we don’t know where we’re going to go is what a lot of folks are facing right now.
We’re going to have a great year this year but we may not reach the potential that the market could hit. You remember the first quote that we mentioned with Lawrence Yun - eight million homes could be sold, but if we don’t have them, we can’t sell them.
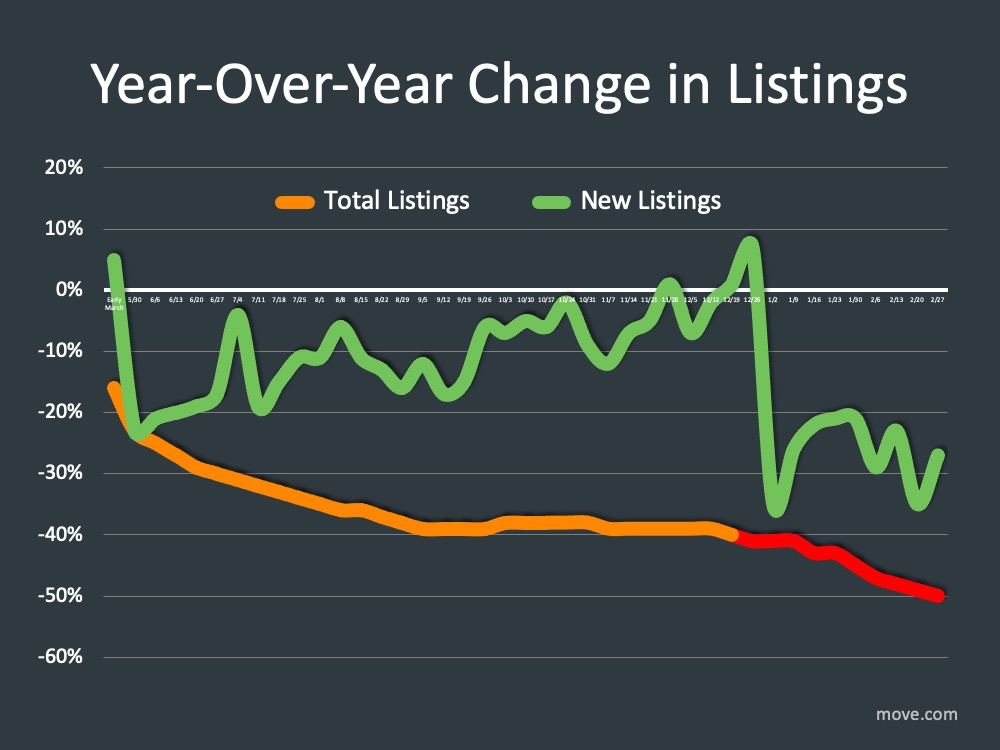
This graph to the right is a look at the year over year change in listings over the last year. The green bar is new listings, and the orange turning to red bar is total listings or inventory. So you see as quickly as it comes to market, it’s being purchased and at a desperately low position across the country. What we need is those listings to come back to market. We talked last time in our Monthly Market Report about where those will come from. From those that maybe put off selling something, from builders to those that feel comfortable this year. Even those that are going to experience a need to sell their home, because of what they went through in the pandemic.
Lawrence Yun says this. “Home sales continue to ascend for the first month of the year, as buyers quickly snatched up virtually every new listing coming to market. Sales easily could have been 20% higher if there had been more inventory, more choices. Again, we can’t sell what we don’t have.”
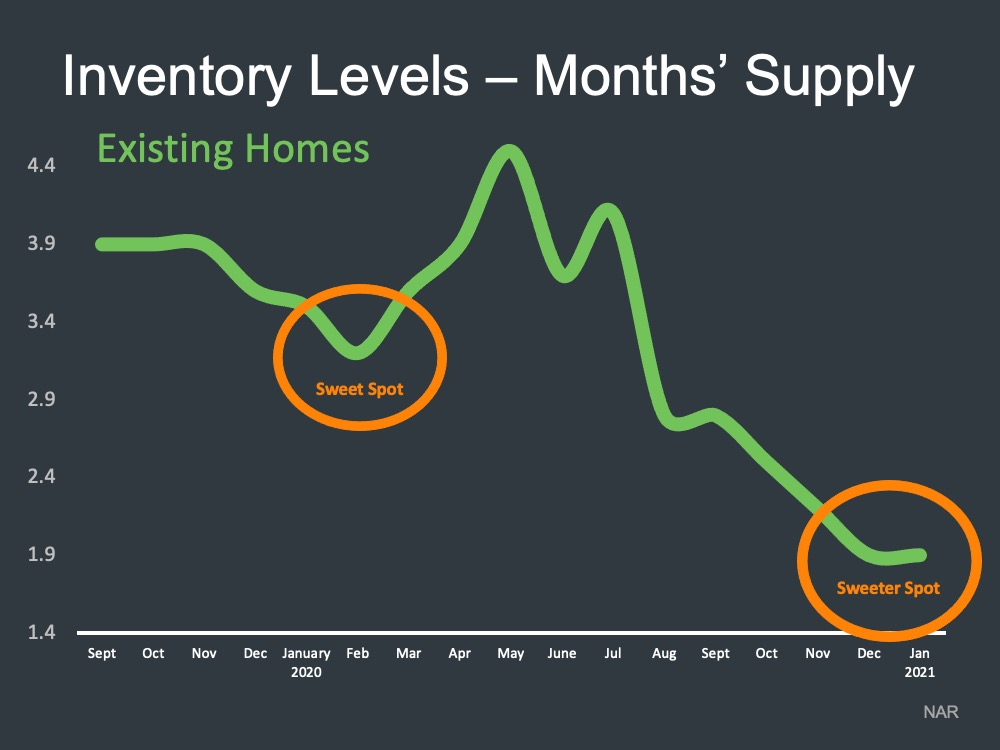
We talked a lot about in the past, the sweet spot to sell something. When do you want to sell something? When there’s fewer of that item on the market than any other time. That is usually around January, February, the very end of the year, beginning of the year. Even last January and February was a sweet spot. But today, we sit at an even sweeter spot with about, average about 1.9 months of active inventory across the country.
Now, depending on where you’re at, that may be a little higher, a little lower. However, we can say it is the sweetest spot in the time that we’ve shown here, and probably in the time that real estate has been sold in your lifetime, to sell a home.
Equity
You know, no doubt the shortage in housing and the demand coming to housing, people are saying, we need to buy something. Rates are low, we’re going to go ahead and do it. It’s caused the price to go up. When that price goes up, what does that mean? It means equity for those homeowners. There will be people that will make a decision to sell this year because they have the equity they can leverage. They can go out and buy another home, and move up. They can do a number of things that they’ve put off doing relative to their home, given the equity gains they’ve seen in the last 12 months.
That brings us to this point, probably one of the big pieces right now that people are talking about is home price appreciation.
Lawrence Yun, Chief Economist at NAR, says this; “A typical homeowner in 2020, just by being a homeowner, they would have accumulated around $24,000 in housing wealth.” Now, while that’s a fact in 2020 for the average homeowner, that’s also a fact for the future. Those that aren’t homeowners don’t have the opportunity to build that wealth.
One of the greatest gifts of home ownership is the financial benefits. If anything 2020 gave us a look at the non-financial benefits of home ownership, the meaning of home, and all the time we’re spending at home. Now we see the financial benefits just as equally as powerful.
It’s got a lot of people again thinking okay, are homes becoming unaffordable?
Mark Fleming says this, from First American; “Nationally, house buying power continues to exceed the median sale price and implies housing is not overvalued today.” You know, we also look at NAR’s Home Affordability Index, and we know that homes are more affordable today. Now, as interest rates rise, as prices go up, that’s going to eat into affordability no doubt. But as we stated today, affordability is looking very, very good. Now, this is a combination of rising wages and lowering interest rates, which bring us good affordability.
As we look forward to this year and what experts are saying about appreciation, they are upgrading their forecasts for appreciation.
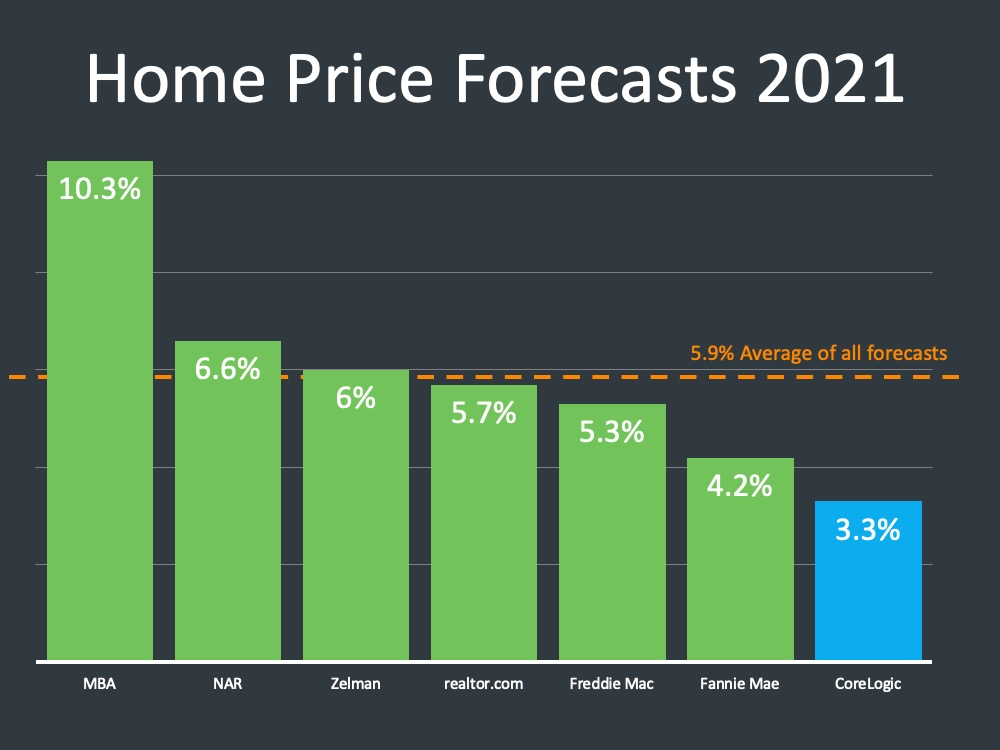
Appreciation is always going to be determined by the supply and the demand, ultimately. There are a lot of people looking at housing pricing today saying all right, we’re running a little hot right now. We’ve talked extensively about this, about historical appreciation at 3.8%, A lot of people are asking the question - "Are we in a bubble?" Here are some pricing comparisons to show pricing today is nowhere near what it was back in pre-housing crash.
Pricing
Here is annual home price appreciation, the four years leading up to 2006. Some of the height of the housing market. And then the four years leading up to today. And what do you see right there? Annual appreciation averaged 10.3% back then, where today it averages just over 6%. Big, big difference, in the amount of appreciation year after year, where we’ve seen a lot of appreciation the last 12 months.
This is spurred on by demand and it’s eaten into the amount of supply, because so many people are looking for a solution in housing. Back then, we would say that was runaway appreciation in those four years and we know that as you have runaway appreciation, something bad is about to happen, and that certainly did in the housing crisis. Where we stand today, we’ve had a lot, but we’ve had higher appreciation in the last year.
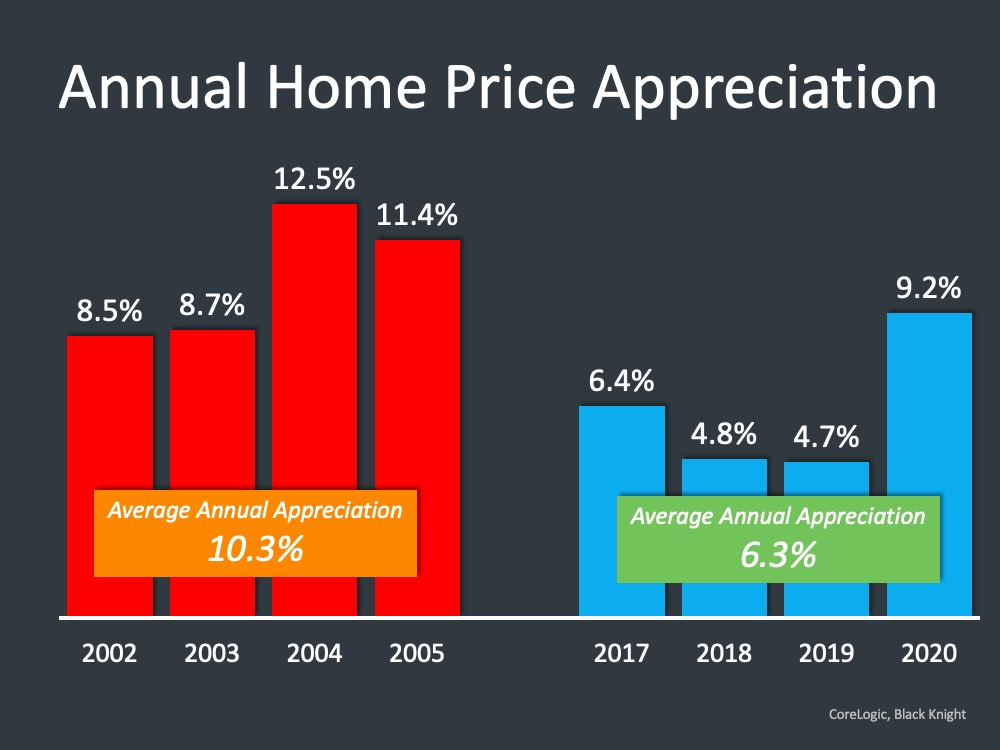
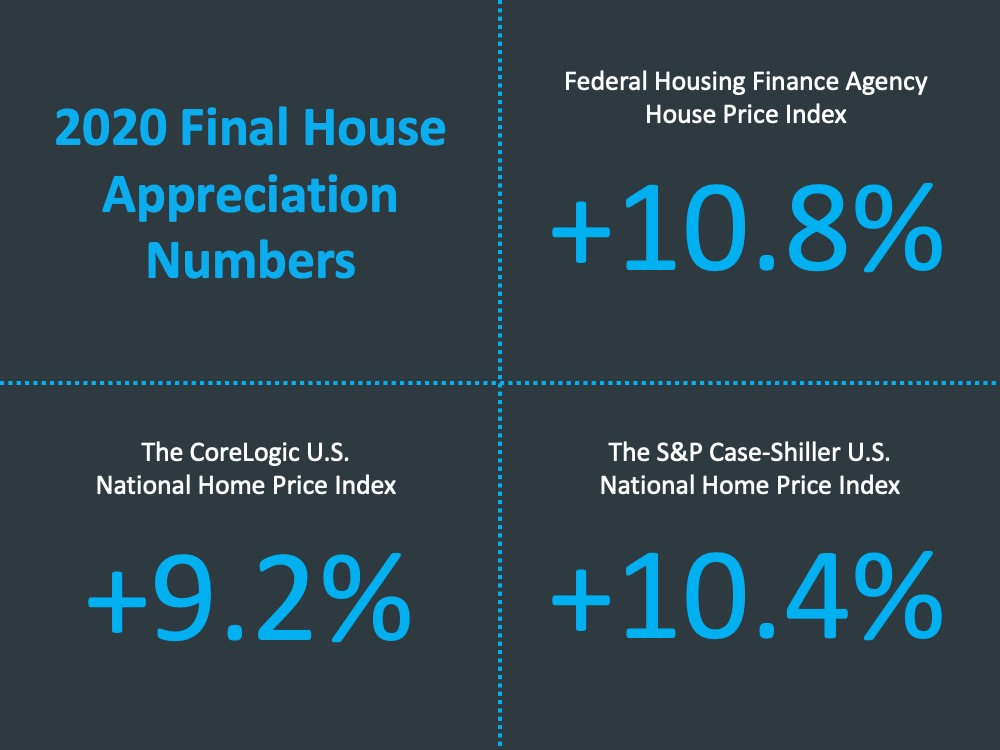
We see the annual average appreciation is nowhere near what it was. If we even go back and look at FHFA maps going back to the fourth quarter of 2020 and we say okay, the country appreciated at 10.8% according to the FHFA and we look at New England at 12.6% whereas back in 2005 New England was at 9.9% appreciation. A very interesting look when you start to look at how was the market performing in 2005, and how is the market performing today - a stark difference.
What are your Biggest Concerns in 2021?
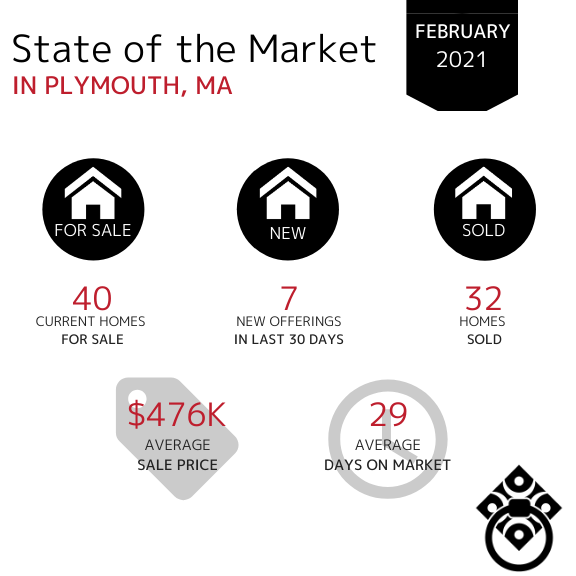
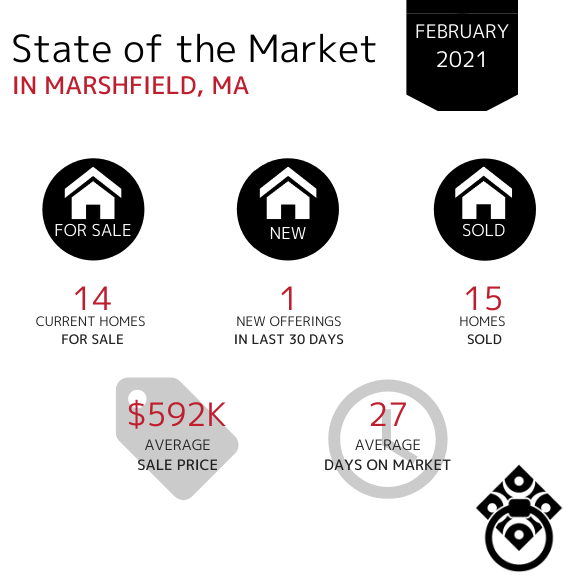
LET'S TAKE A CLOSER LOOK AT HOW YOUR TOWN DID IN FEBRUARY OF 2021 ⤵️
In the Town of Plymouth, home sales continue through the month of February down from 55 homes sold in January. The Average Days on Market remained relatively steady just under one month. The the Average Sale Price has decreased from the mid-$500k range for the first time in two months.
In the Town of Hingham, the number of new homes entering the market has increased for the first time in a few months with 19 home available to purchase at this time . Homes continued to spend more time on the market than they did in December. The Average Sale Price increased from $959k in January back into the million dollar bracket. Significantly less homes sold in the month of February, down from 15 homes in January.

In the Town of Scituate, the Average Sale Price decreased from $777k in January. Home sales decreased again in February, down from 19 homes sold in January.

In the Town of Marshfield, the number of homes sold remained consistent from January through February at 15 homes sold each month. Properties spent slightly more time on the market during February. The Average Sales Price decreased for the first time in the last two months, down from $755K in January.
In the Town of Kingston, the number of new offerings has increased slightly over the last two months bringing numbers into the double digits. The number of homes sold was remaining consistent month over month however it dropped by more than 50%. The Average Sale Price has increased into the mid-$600K range.

In the Town of Duxbury, the Average Sale Price of homes has increased once again from $857K in January. Available inventory has also increased ever so slightly as well as new offerings in the last 30 days. This tells us that Sellers are entering the market as we head further into the new year. The Average Days on Market increased from 10 days in January to one month on market in February this could be due to slightly more inventory and options available for buyers to view before making a decision.

In the Town of Norwell, the Average Days on Market have decreased again from 12 in January showing that homes are spending even less time on the market. There is limited inventory in many towns, including Norwell however, the number remains fairly consistent month over month with only slight fluctuations. The number of homes sold remain consistent and the Average Sale Price increased from $749k in January.

In the Town of Cohasset, the amount of available inventory has remained consistent over the last five months which shows a steady market. The number of days on market has increased for the first time in 3 months to just over 2 months. The Average Sale Price decreased from $2.1mil in January but it still remains in the million dollar bracket.

In the Town of Hanover, the number of homes sold dropped slightly from 10 in January. The Average Days on Market increased slightly and the Average Sale price has decreased by $91,000.

In the Town of Pembroke, the current amount of available inventory continues to be extremely low. There have been no new offerings within the last 30 days which could likely be attributed to the overall lack in available inventory. Simply put, sellers are not ready to place their homes on the market. The Average Days on Market increased dramatically from January to February, with an average of nearly 2 months time vs. 18 days in January. The Average Sale Price has increased once again from $519K in January.

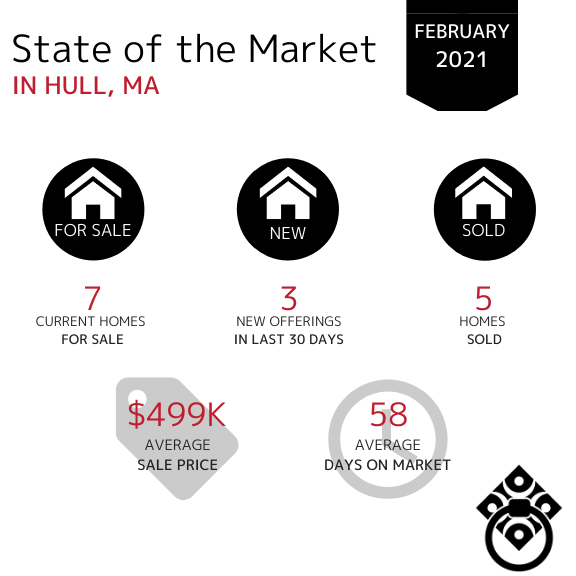
In the Town of Hull, the number of homes sold has decreased by 50% for the first time in the last 3 months. Homes entering the market have remained consistent and there is still a very limited amount of available inventory.
The Average Days on Market have dramatically increased from 13 days in January. The Average Sale Price has remained within the $400k bracket with a slight increase since January.
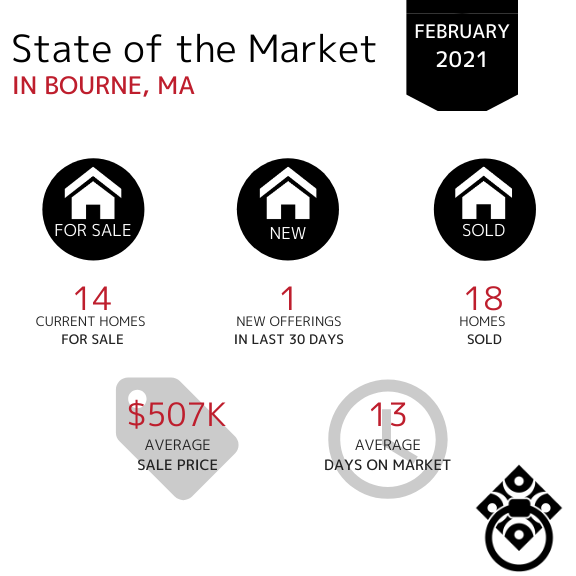
In the Town of Bourne, the amount of available inventory has leveled off and remains consistent month over month. The Average Days on Market has decreased again form 24 days in January which tells us that the buyer demand is strong and they are actively purchasing the homes that are available. The Average Sale Price has decreased from the mid-$600k range and the amount of homes sold in February decreased slightly.
In the Town of Sandwich, the Average Days on Market increased significantly while the number of homes sold remained fairly consistent since January. Available inventory decreased from 28 available homes in January to 14 currently available. There was a $100,000 decrease in the Average Sale Price in February.

In the Town of Mashpee, the Average Sale Price is broke into the million dollar bracket once again vs $732K average in January. The Average Days on Market have remained consistent over the last 2 months. Similarly, the number of homes sold has remained fairly consistent with 14 sold in January.

In the Town of Falmouth, the Average Sale Price has increased from $635K in January. With limited inventory in most towns, there are still a good amount of new homes entering the market as we moved through the month of February even with an overall decrease. The number of homes sold has decreased by nearly 50% since January.

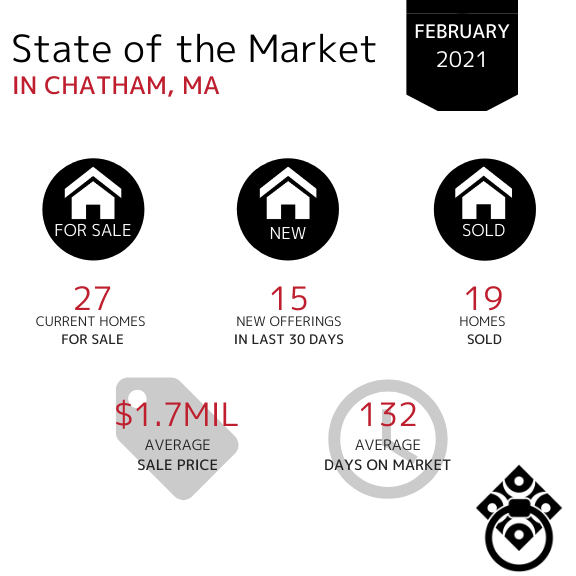
In the Town of Chatham, home sales decreased from 26 homes sold in January. The Average Sale Price has remained in the million dollar bracket over the last six months with a another increase from $1.6M in January. Homes have spent increasingly more time on the market month over month since December.
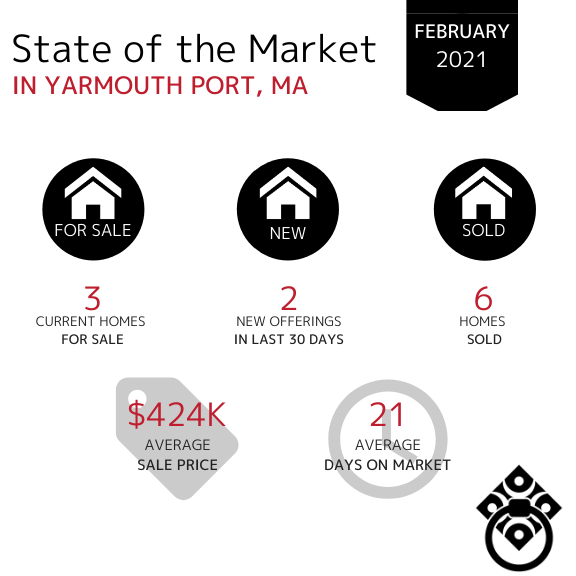
In the Town of Yarmouth Port, property sales have continued to decrease slightly since December. The Average Days on Market decreased from 51 days in January and similarly, less homes also entered the market in the month of February.
If your town wasn't included in this report,
click here and let us know. We'll be happy to get you that data!
Learn How Much Equity Your Home Has Gained...
VIRTUAL SELLING
SEARCH FOR HOMES
*Market Information obtained from MLSpin, Cape and Islands MLS and Keeping Current Matters*