

We have continued to crunch data from the South Shore and Cape Cod Association of Realtors® Multiple Listing Services (MLS) to help our clients and community better understand the impact of COVID-19 on our local market as we have begun to enter into the first re-opening phases put into place by Governor Baker.
Last updated 6/2/20
This report is for single family homes in Plymouth County and Barnstable County. Please note Condos, Multi-family homes and land are excluded.
New Listings: New listings inventory has continued to decrease year over year. Down 39.68% from this time last year. In 2019 - 1,487 listings were available in Plymouth County as of 6/2/19 whereas there are only 897 homes on the market as of today. There was a larger decrease as we enter June at 20.4% in the number of new listings in Barnstable County.
Price Changes: Sellers are still not negotiating in the current market. 40.6% less Seller's have adjusted their asking prices this year versus 2019. Price change data is currently unavailable for Barnstable County.
Pending Contracts: As of June 2nd, there has continued to be a decrease in the number of pending sales of 14.71% from what the numbers were during the Spring Market in 2019. However, average days on market remain steady year over year. Pending data is currently unavailable for Barnstable County.
Closed Sales: A strong start of 2020 has helped Sold data remain rather unscathed in however there have been a further decrease from -1.33% to -7.81% from April vs. May (year over year) in Plymouth County. In Barnstable County, a larger decrease of 14.4% less sales year over year as of June 2nd shows that the market on the Upper Care was still slowing in May.
Mortgages: Mortgage rates have begun to stabilize over the last month and continued into the month of June as the market begins to stabilize. Readily available mortgage types continue to be Conventional (Fannie Mae and Freddie Mac), Government (FHA and VA with tighter FICO score requirements), USDA, Mass Housing, Renovation and Jumbo (although some lenders don't have access to some of the bank investors that are doing them).
We are here to help: We are here for you to answer any questions and help you find solutions and possibilities during these uncertain, changing times. Please do not hesitate to contact us at [email protected] or call 508-746-0033.
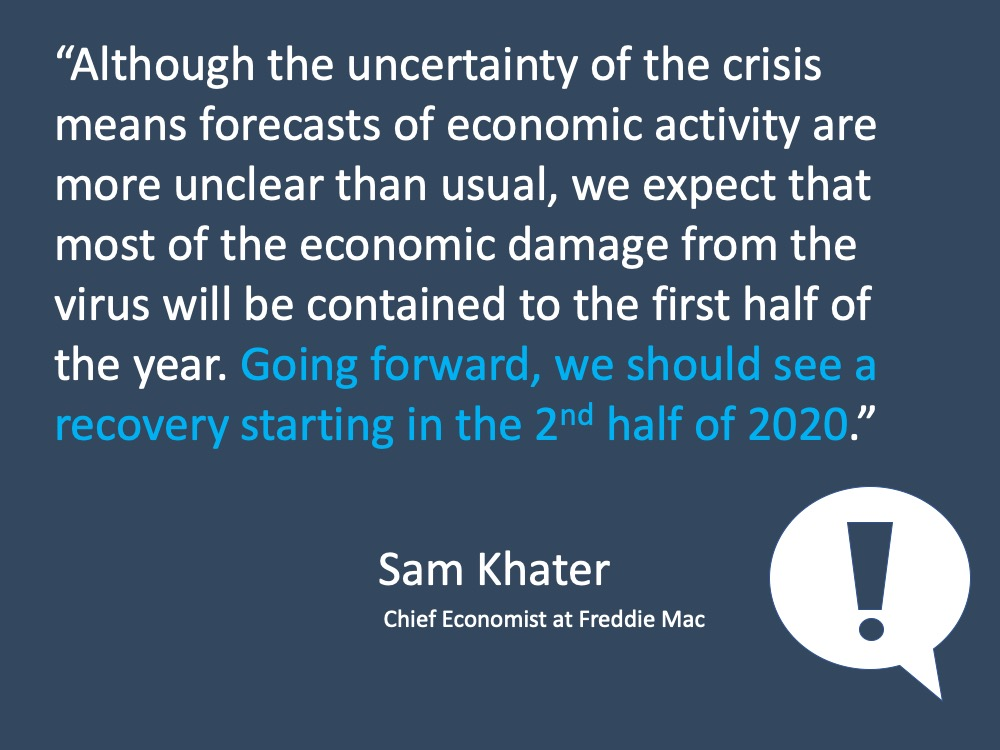
#1.. When is the economy going to recover?
As we start to look to the second half of the year, we’re looking to more businesses coming online and more economic activity growth. What makes it unique right now, though, are the three sciences that economists have to deal with right now.
We're in a time right now where we’ve got to layer on two additional sciences, the first being the health science. That’s answering the question, when will COVID-19 be under control and will there be a flare-up of the virus this Fall? And taking that into account as they’re making projections.
The other part is the people science. And that’s after businesses are fully operational, how long will it take for American consumers to return to normal consumption patterns, going out to a movie, attending a sporting event, eating in restaurants, things like that.
So, while we deal with this situation that is the coronavirus, economists are dealing with answering a lot of questions on these projections. But what we can be confident in, is no one is calling for an L recovery. We’ve heard the terms U and V, but an L recovery is when the economy goes down and it stays down - this is not what we want. The good news is, no one is calling for that.
CNBC stated “Evidence is mounting that home buyers may be coming back to the market, and after demand plummeted in the past months due to coronavirus.” So, starting to see the evidence of homebuyers coming back, after we just this fall off in demand. It really comes to what we do know and what we do not know right now.
There is question about a vaccine and there is the idea of how do we open up the economy in a safe way and bringing things back online. So there are a lot of things that are 'unknowns' right now. But what do we know? We know that we started this year stronger than ever. We’re at a record low interest rate environment. Equity is strong among homeowners. We’re in a high unemployment time right now, hopefully temporarily, and we know the Fed is doing everything they can to support the economy.
#2.. What is happening with the Housing Market?
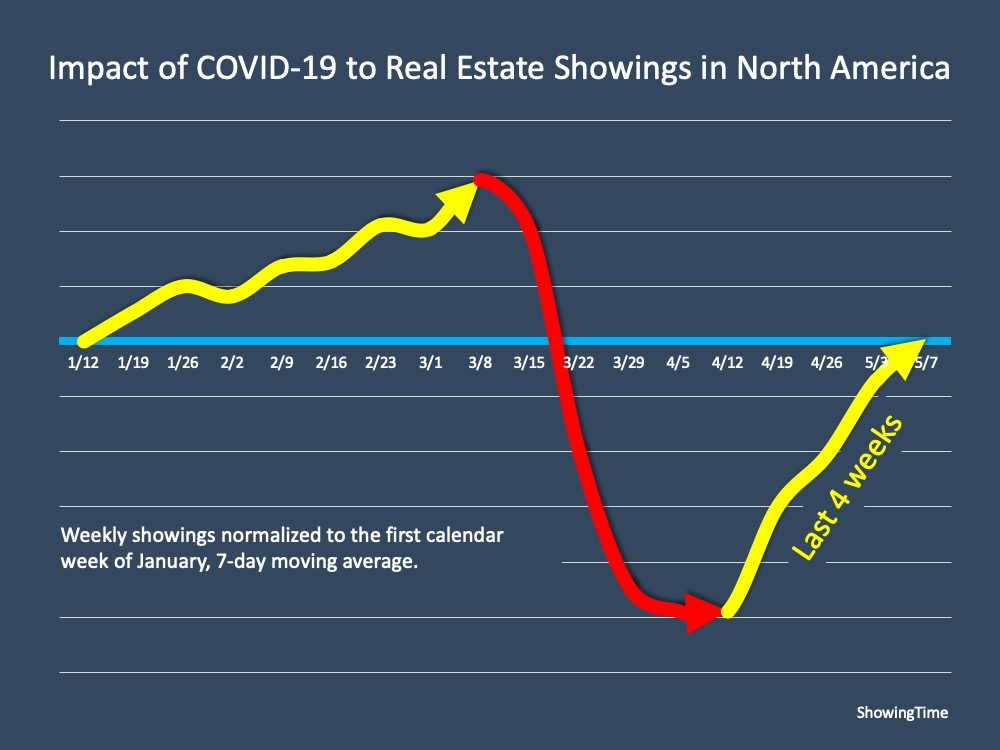
This graph shows showings across North America coming from ShowingTime. What you can see is that as we started off the year the trend was going up, and then the beginning of March just fell off a cliff as consumers retreated to their homes out of fear of contracting the coronavirus.
However, you see the bottoming out across North America in the middle of April and then this rise back up. Certainly some of that is going to be due to pent up demand as people retreated. It’s safe to say that we have seen the bottom in the showings and people are ready to continue with their real estate transactions.
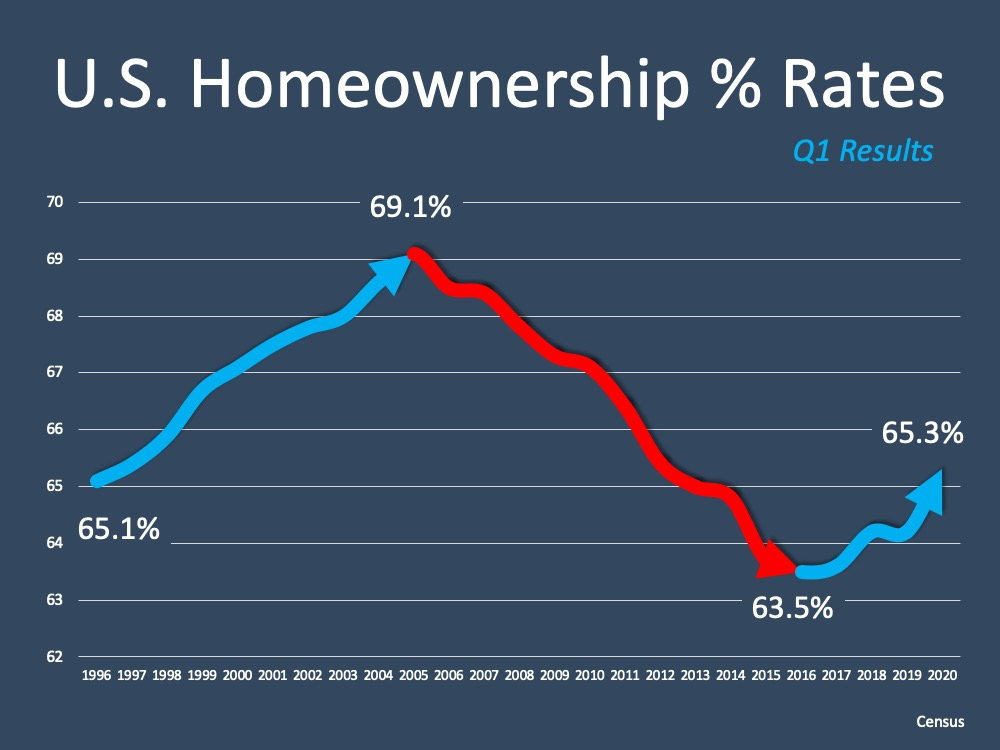
Some good news is that the U.S. home ownership rate is climbing. We expect that to climb after a bottom out the last 4 years, we’ve seen this upward trend of people wanting to own a home and enjoy the benefits of home ownership.
Why is that happening? Much of that is due to the rising cost of rent across the country. Renters don’t get the advantages of a refinance, the tax advantages of home ownership, or the pride of ownership. We know that through studies we’ve looked at, renters are saying more and more "I want to become a homeowner."
#3.. What are the major advantages of home ownership?
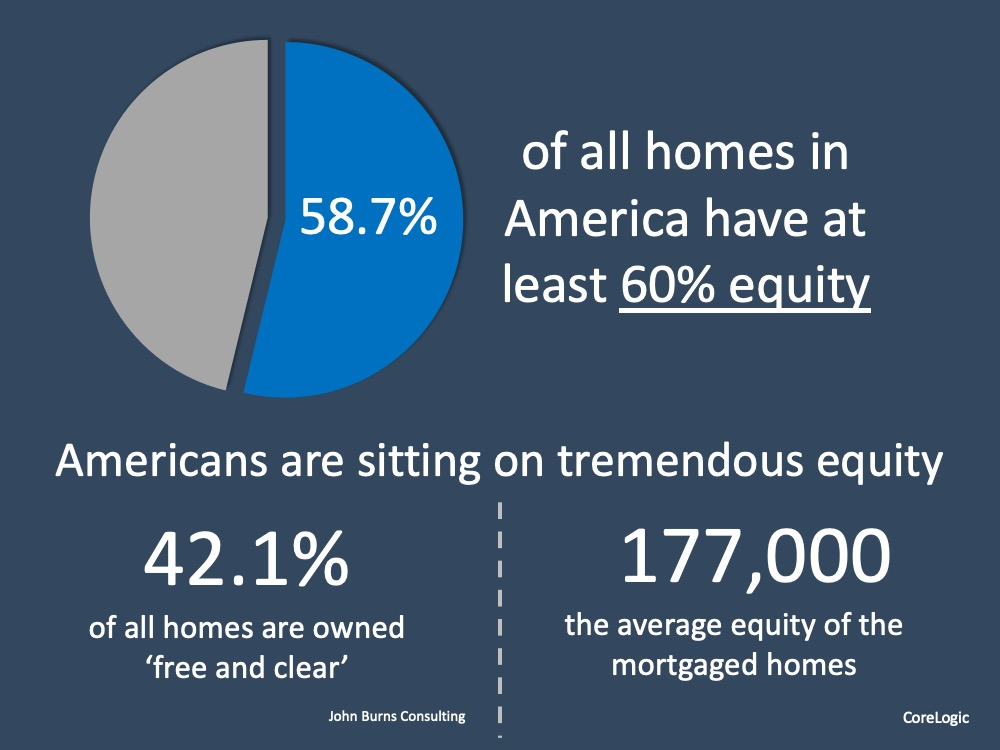
The 2020 equity numbers recently came out and that number has jumped up to 42.1% own their home free and clear. What is interesting is the amount of people that have equity over 60% is now at 16.6%. You can follow it all the way around. If you get down to less than 10% equity, that’s only 7.3% of homeowners in the country. If you think back to 2008, we know that a lot of people used their houses as ATMs, and were really building up, or lessening the equity in their home. So we’re back to the way it’s supposed to be.
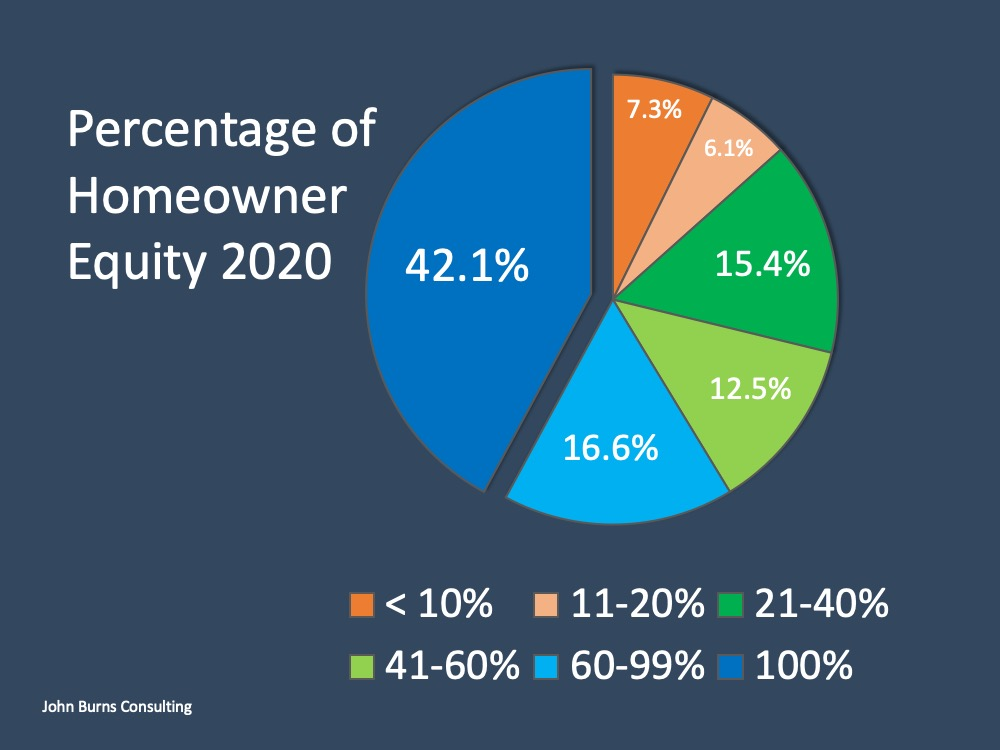
Now if we look at it overall, we can see that this number jumped also a little bit. 58.7% of all homeowners now have at least 60% equity. It's crucially important that people know that there is that much equity in their homes right now, for a whole bunch of different reasons. It is important to know so those that are are afraid that people are going to run into a heavy foreclosure market again, aren't. Those people have hundreds of thousands of dollars’ worth of equity in their home. They’re not walking from that house. They’ll sell it first if anything.
#4.. What is happening with unemployment?
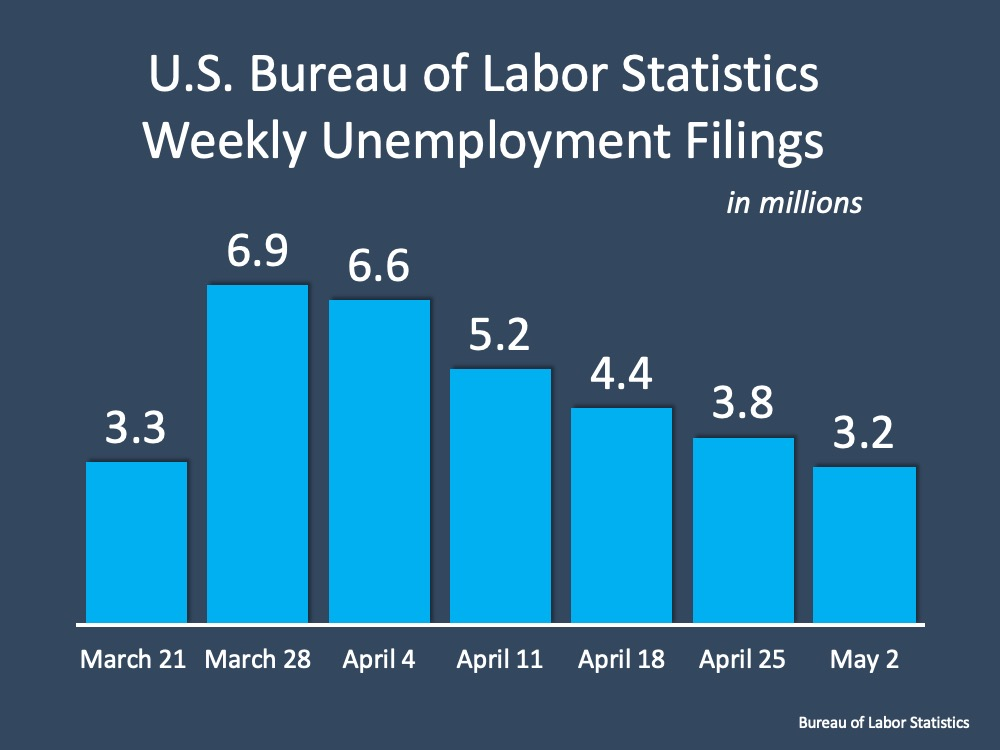
We can see we’ve hit the apex of people filing unemployment claims, and we’re starting that downward slide now. As mentioned before, now that things are starting to open up again, more and more people are going to get their jobs back. It’s going to be interesting as we proceed forward but what we can see with this slide, is the number of people that were being unemployed, that’s going down week over week over week.
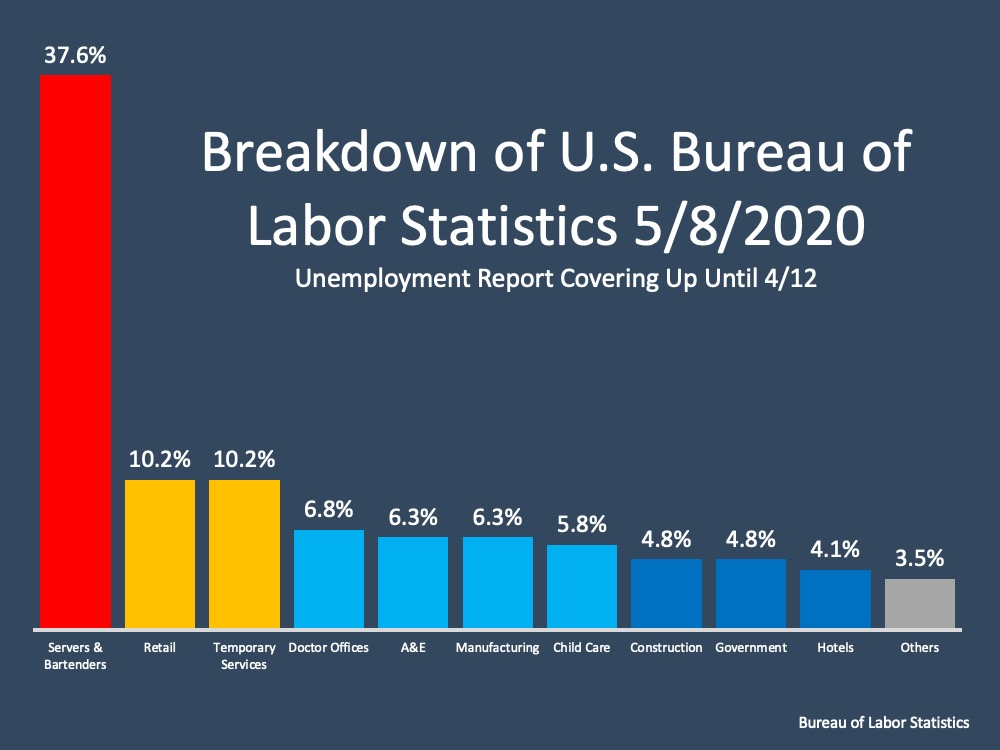
This is a breakdown of percentage of all the people who are unemployed:
More than one out of three people that are unemployed are bartenders or servers. So we know that that’s primarily a very high percentage of the unemployment rate. Now, as restaurants begin to open, even that are opening with social distancing and other requirements, that number will come down.
Doctor's and Dentist's offices and their employees will definitely be back to work. Arts and entertainment, maybe not as quickly. Childcare we think is going to open up. Construction we think is going to open up immediately. So as we look at this, we can get a feel that it’s a pretty high unemployment rate. It’s 14.7% - but it’s broken down to a lot of categories that we believe are going to come back pretty strongly.
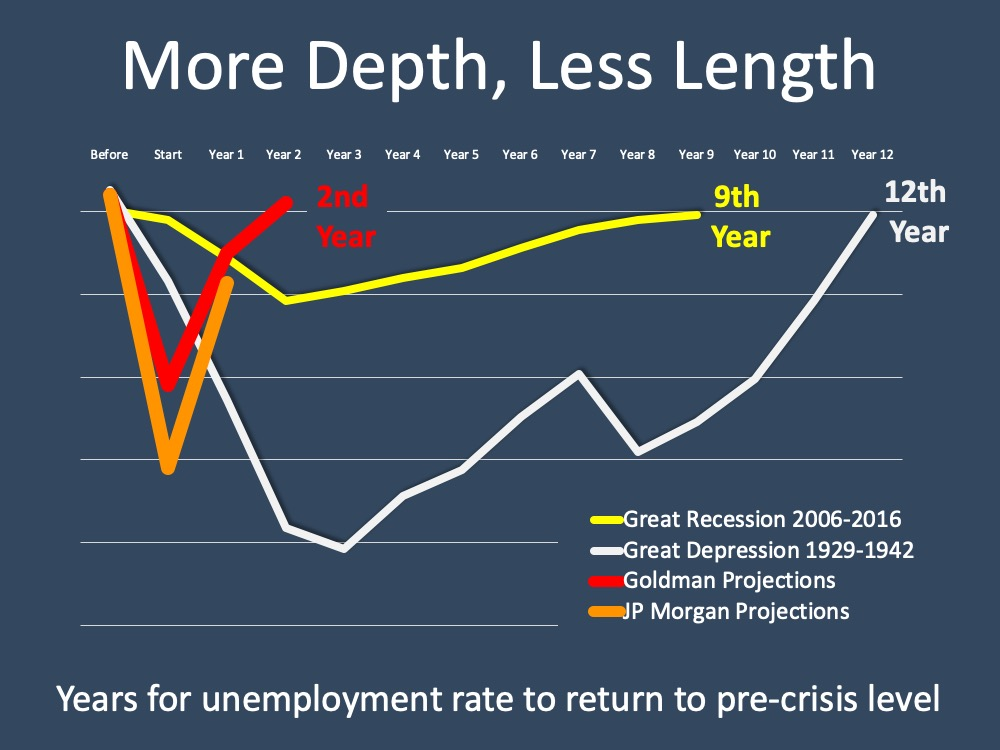
We know that J.P. Morgan projected that it’s going to drop to 20%. We are unsure if it’s going to go any higher than 14.7%. We’ll know more during the month of June. With a lot of the country opening up, we're not sure it will.
In each case, the jobs are coming back quickly. Unlike the Great Recession of 2006-2016 and the Great Depression, which took years upon years upon years for the unemployment rate to come back.
#5.. What is happening with real estate inventory?
Currently, we don’t have a challenge with pricing. What we do have is the fact that we have a historically low inventory and because of that supply and demand, buyers are still out there, not so much sellers. So we’re not going to have a challenge with prices but more listings do need to come to market.
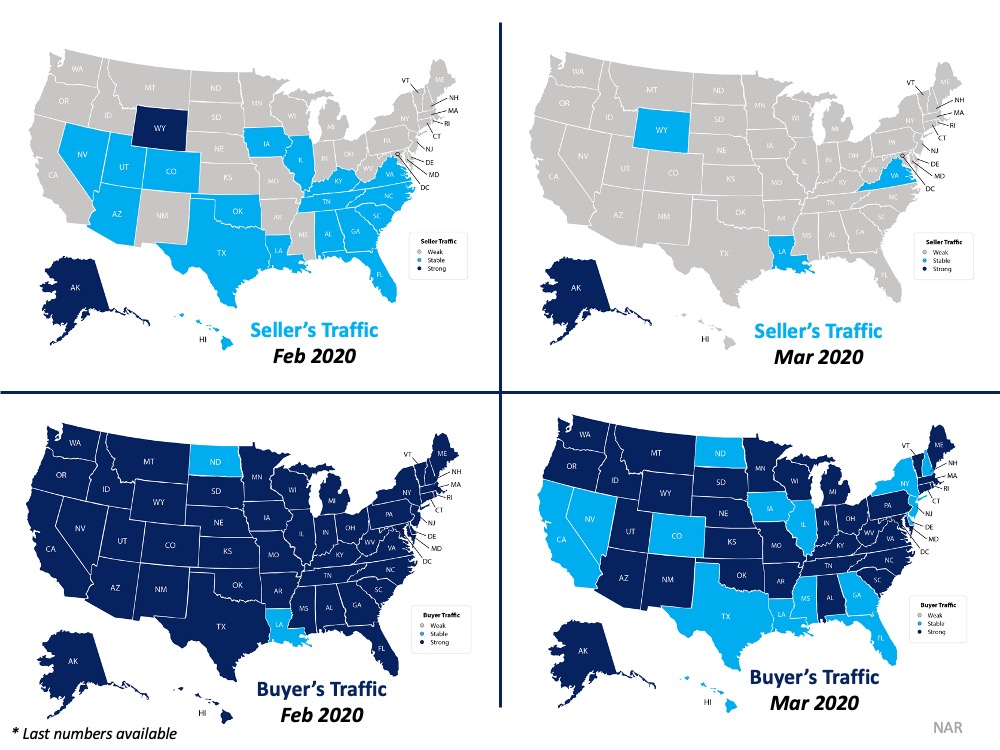
If we
take a look at the graph, what we can see is up in the upper left hand corner is seller traffic for February, the April numbers are not out yet so the most current numbers are March. So February, we started seeing seller traffic start to increase.
We start seeing a lot more states turning light blue and even two states turned dark blue. Meaning that in many states people were putting their homes on the market.
Then March hit, the world stopped and we could see looking at the seller traffic on the upper right hand side, that the number
of states where listing inventories were increasing they dropped off dramatically. However, if we
look at the buyer side down at the bottom on the left hand side, that was February. It was strong in so
many states. If we go to the bottom right hand corner, it
definitely weakened some but it didn’t get to the point that they were any truly weak markets as those would be shown in grey.
So we still have a very strong buyer demand, which is
going to continue to increase.
LET'S TAKE A CLOSER LOOK AT HOW YOUR TOWN DID IN THE MONTH OF MAY ⤵️
In the Town of Plymouth, home sales decreased slightly in the month of May down from 65 in April. The decrease in the number of Average Days on Market tells us that Buyers are still actively securing homes even with low inventory levels.
Homes continue to enter the market and the number of new offerings within the last 30 days has increased from April to May.

In the Town of Hingham, there was an increase in new inventory throughout the month of May showing us that Sellers are beginning to come around to the idea of placing their homes on the market. More homes sold during the month of May vs. April however the Average Sale Price has decreased from $1.1M in April to $826K in May.

In the Town of Scituate, the Average Sale Price continued to increase as it did in April, up $45,000 in the month of May. Home sales picked up in May and were selling much faster at about 2 months time vs. nearly 4 months in April. The number of homes SOLD also increased as did the number of new offerings throughout the month. This tells us that with the summer months approaching, the beachside town of Scituate is becoming a more active market for both Buyers and Sellers.

In the Town of Marshfield, the number of homes sold during the month of May increased along with the number of new homes entering the market. This tells us that Sellers are becoming more comfortable with the idea of listing their homes on the market and Buyers now have a bit more variety. Properties are selling at a slightly slower pace - in just over 2 months.

In the Town of Kingston, there was a decrease in each category. Available inventory decreased slightly as well as the number of homes sold. The Average Days on Market decreased from 76 in April to 30 in May. The Average Sale price dropped by $27,000.

In the Town of Duxbury, the Average Sale Price of homes remained in the million dollar bracket for 2 months straight showing strong home value. Available Inventory has decreased slightly along with the Average Days on Market from 69 to 57 in May. This indicates that buyers are serious and now is a great time for Sellers to get their homes on the market.

In the Town of Norwell, the average days on market increased from just over 1 month to 2 and a half months. There has been a consist amount of inventory from April through May. The Average Sale Price has decreased from $734K in April.

In the Town of Cohasset, the amount of available inventory has increased throughout the month of May which is a great sign for Buyers! The number of days on market dropped from 121 in April to just 52 in May. This shows us that buyers in this market are ready and willing to purchase when inventory is available. Average Sale Price has decreased slightly just outside of the million dollar bracket.

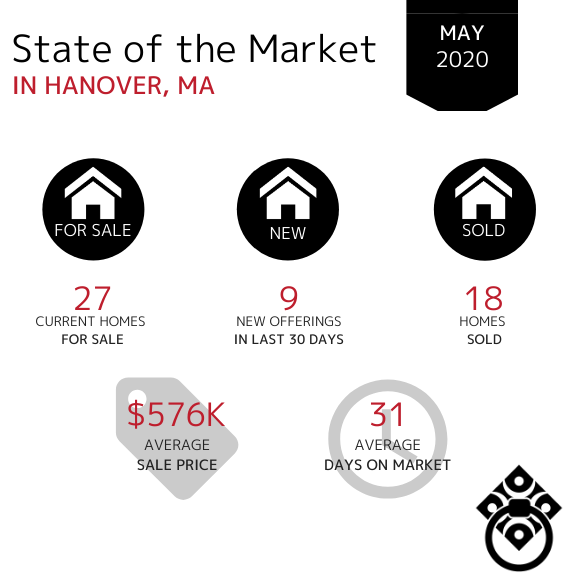
In the Town of Hanover, the number of homes SOLD have increased slightly in May. The Average Days on Market significantly decreased from 81 in April to 31 in May which indicates a positive direction in the market in Hanover.
In the Town of Pembroke, the amount of new offerings in the last 30 days have decreased however the total amount of homes for sale has increased slightly. The Average Days on Market increased from just over 2 months to just over 3 months in May. The Average Sale Price has remained consistent in the mid-high $400,000s over the last three months.

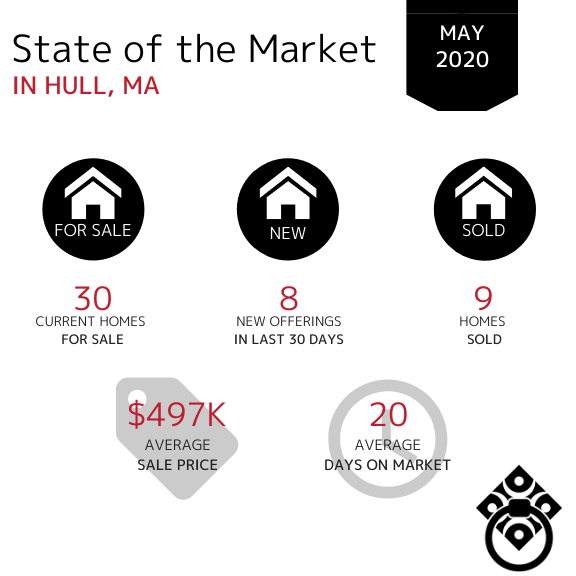
In the Town of Hull, the number of homes SOLD has increased slightly in May. Buyers are still active however, with a lack of inventory buyers don't have much to choose from. Homes continually remained on the market for a much shorter time than they did back in March (111 days). The Average Sale Price has remained consistent from April through May.
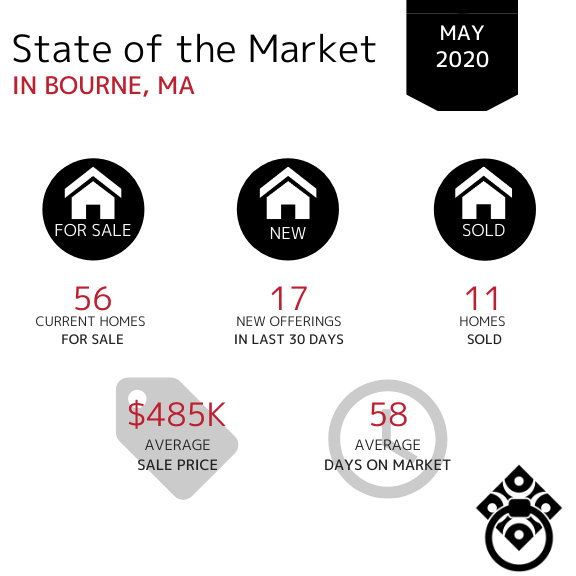
In the Town of Bourne, the amount of available inventory has remained consistent however the number of new offerings in May increased from only 8 in April to 17 in May. This tells us that homeowners are beginning to place their homes on the market as we navigate through the new phases set in place to get back to the new normal. The Average Days on Market significantly decrease from 141 in April to 58 in May. Once again, this tells us that the buyer demand is there and the lack of inventory is hindering them buying at an even faster pace. The Average Sale Price has increased by $21,000 in May.
In the Town of Sandwich, the Average Days on Market have finally begun to decrease as we closed out the month of May down from 123 days in April. The number of homes sold nearly doubled in the month of May and the amount of new inventory in the last 30 days increased as well! The Average Sale Price has increased by just over $100,000. This data shows that the Sandwich market has begun to stabilize as we begin to enter the summer months.

In the Town of Mashpee, the Average Sale Price has remained relatively consistent month over month in the mid-high $500,000s. The Average Days on Market have increased from April to May. The number of homes sold has remained consistent through the month of May however there is more available inventory which shows us that buyers are taking their time in choosing what they are purchasing due to inventory availability.

In the Town of Falmouth, the Average Sale Price has continued to decrease month over month since March. The number of new homes entering the market in May have increased by 50% indicating that Sellers are beginning to put their homes on the market. The number of homes SOLD have decreased slightly but they are selling at a faster pace than they were in April spending just under 3 months on the market.

In the Town of Chatham, home sales decreased during the month May. The Average Sale Price has increased back into the million dollar bracket as the month of May came to an end. The Average Days on Market increased significantly in May at 319 vs. 120 day in April. This could be an indication of homes that were on the market for a significantly long period of time have finally sold which does have an overall impact on the monthly averages.

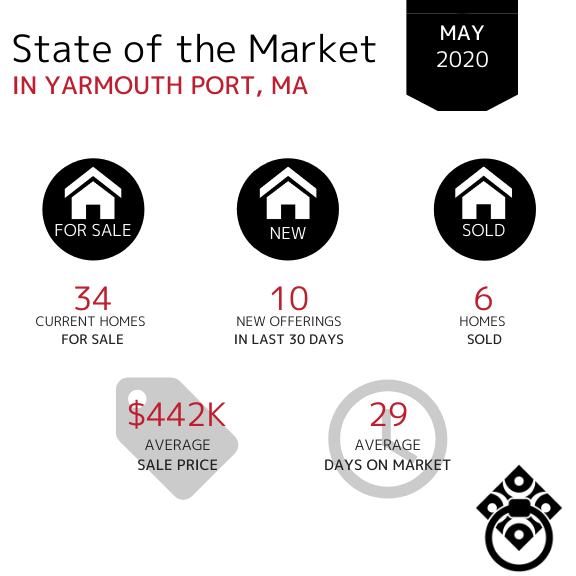
In the Town of Yarmouth Port, property sales have remained consistent. The Average Days on Market have decreased significantly since April just as it did in March however, there is still a lack of new inventory entering the market which could cause the average days on market to rise again.
If your town wasn't included in this report,
click here and let us know. We'll be happy to get you that data!
VIRTUAL SELLING
SOLD DURING COVID-19
Looking for your Dream Home?
*Market Information obtained from MLSpin, Cape and Islands MLS and Keeping Current Matters*