


We have continued to crunch data from the South Shore and Cape Cod Association of Realtors® Multiple Listing Services (MLS) to help our clients and community better understand the state of the local real estate market as we ended 2020 and predictions of what to expect in 2021.
This report is for single family homes in Plymouth County and Barnstable County. Please note Condos, Multi-family homes and land are excluded.
New Listings: New listings inventory continues to remain down by 65% from this time last year. In 2020 - 813 listings were available in Plymouth County as of 2/11/20 whereas there are only 278 homes on the market as of today. There was a decrease of 42% in the number of new listings in Barnstable County as compared to 2020.
Price Changes: It is certainly still a Sellers market due to low amount of inventory. Sellers are still not in a market where they need to be negotiating and they're are getting more money for their homes than they would have at this time last year. 62 homes changed their prices last year vs. 28 YTD. Price change data is currently unavailable for Barnstable County.
Pending Contracts: As of February 11th, there are 10% less homes with sales pending compared to last year. The average days on market has continued to decrease as demand remains high in the current market. Pending data is currently unavailable for Barnstable County.
Closed Sales: The market has continued to be extremely active even with limited inventory. That has not stopped as we enter into 2021, as of February 11th 13% more homes have sold in 2021 vs. 2020. The number of listings sold in Barnstable County is up 8.4% as of 2/11/21.
Mortgages: Mortgage rates have recently dropped again and remain lower than usual with a strong real estate market. Readily available mortgage types continue to be Conventional (Fannie Mae and Freddie Mac), Government (FHA and VA with tighter FICO score requirements), USDA, Mass Housing, Renovation and Jumbo (although some lenders don't have access to some of the bank investors that are doing them). First time home buyer rates are low right now and it's a great time to take advantage!
We are here to help: We are here for you to answer any questions and help you find solutions and possibilities during these uncertain, changing times. Please do not hesitate to contact us at [email protected] or call 508-746-0033.
2021 Real Estate Market Predictions
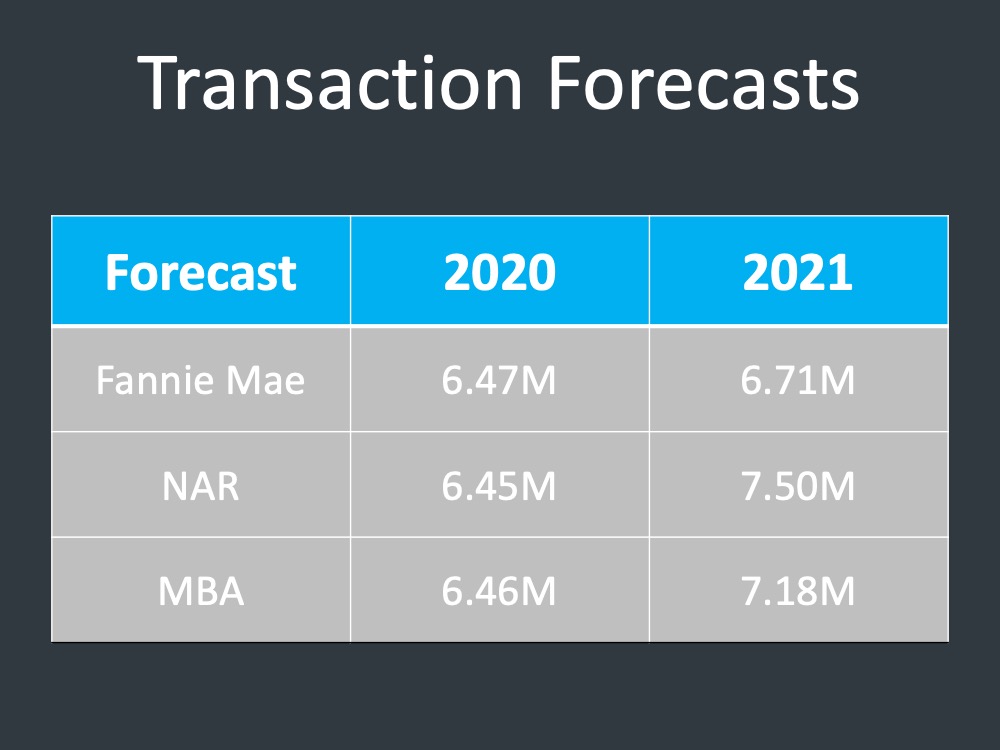
As experts look forward, we’re projected to
sell even more in the coming year. Below are the transaction
forecasts from Fannie, from NAR, and from MBA, each one of them having more sales this
year than we had last year during the pandemic.
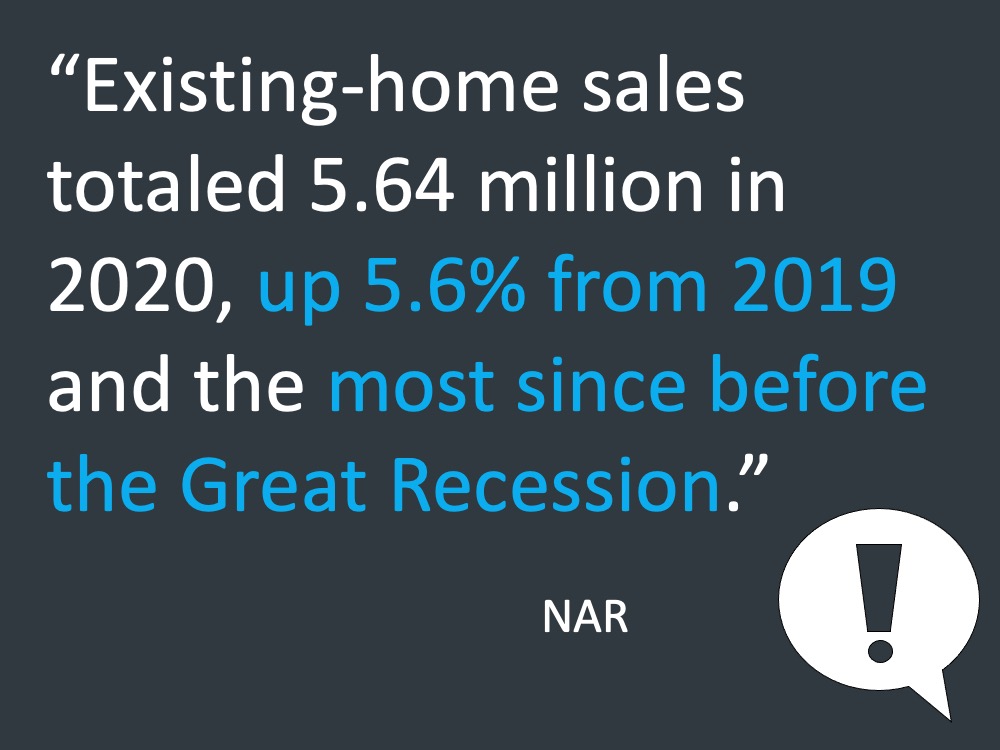
Now, what’s the story here? The 2020 market is really setting up the 2021 market.
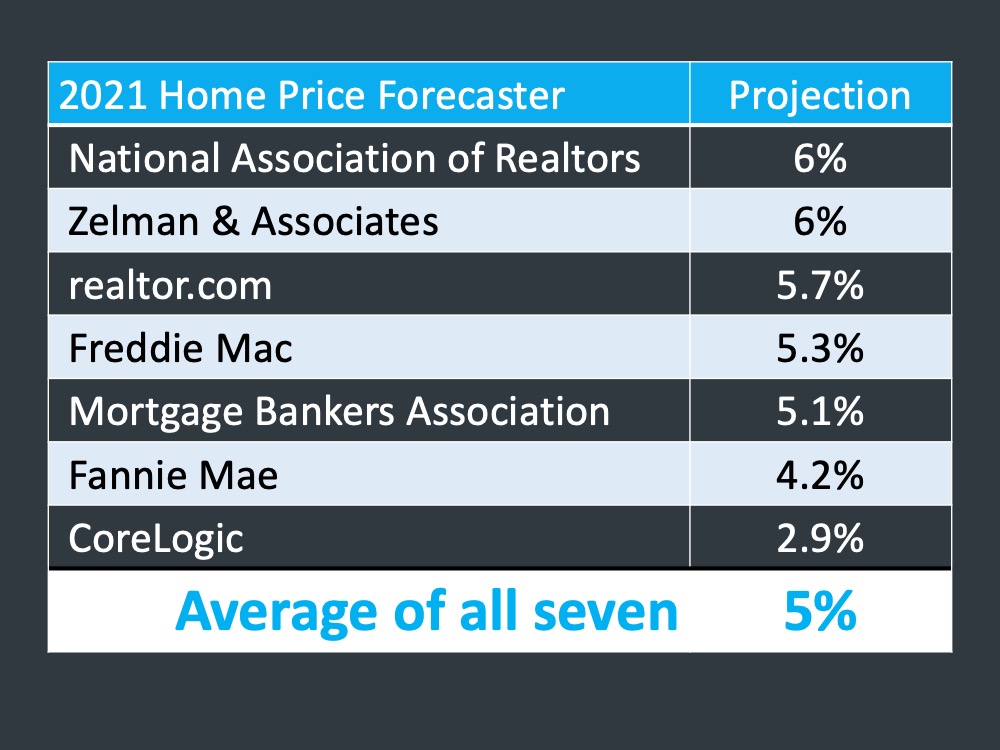
If we continue with what experts are saying right now, we have the most up to date home price forecasts and you can see this one here covering a scale of anything from NAR down to CoreLogic, and everywhere between, the average of these seven forecasts is about 5%. It's important to remember that historically in this country, home price appreciation has been about 3.8%. We are seeing that number above the historical appreciation number.
What does that mean? Well, price will always be a factor of supply and demand. As we look at what CoreLogic just said about the 2020
market, is that home prices increased 9.2%. Quite a hefty increase due to what? Limited
supply and more and more people saying, we need a home. As you look at these home price forecasts right now, we can see there’s going to
be more supply coming into the market and there’s certainly going to be more demand. The experts are saying, we’re going to see healthy appreciation in this real
estate market.
Interest rates are something certainly that all of us are wondering about and talking about. This graph is the latest look of projections from Freddie Mac on the 30-year fixed rate.
What’s different this time? We’re starting to see that rise and as we go
through the year, we could be seeing it rise up even more as the economy starts to improve. The reality right now is that we are forecasting and by looking at experts, that we’re going to be
in a good rate environment in 2021. Certainly, in the low threes, whether that’s 3.2%, 3.5% or
whatever forecasters continue to say throughout the year.
Historically speaking, as we can see here, in a very advantageous interest rate market going
forth this year and that’s going to cause more people to say, now is the time.
There is no doubt that affordability will be eaten into as rates rise and as prices rise. “Rising interest rates reduce house buying power and affordability, but are often a sign of a strong economy, which increases home buyer demand. By any historic standard, today’s mortgage rates remain historically low and will continue to boost house buying power and keep purchase demand robust.” - Mark Fleming, Chief Economist at First American
Historically speaking, a rising
rate environment is signaling a better and improving economy. The
gift of an economic slowdown is that we see the fed working and the federal government
working to help lower home loan rates by the levers they have, to help spur the economy
forward. They know the economy will not recover until housing
recovers.
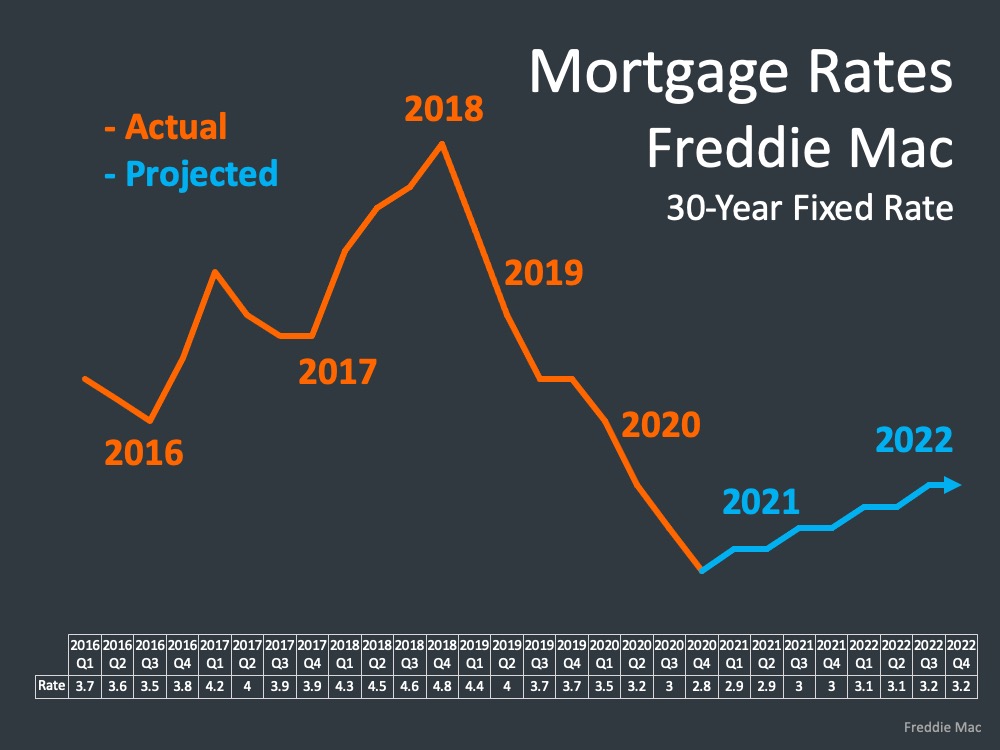
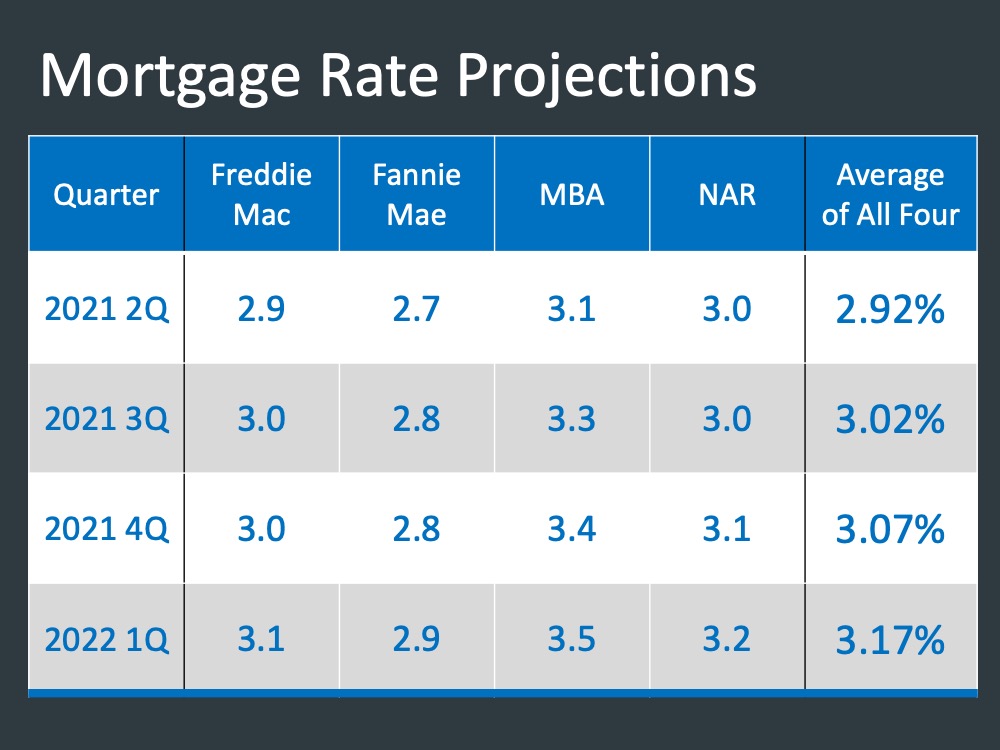
If we look at what experts are saying, this is the latest rate projects going all the way through
the first quarter of 2022 and you can see there’s a range there. 3.1 on the low side, 3.55 on
the high side. Altogether showing this environment that we believe is going to be a very,
very good rate environment.
What About Inventory?
Now is the time to go ahead and transact, buy, sell, whatever you’re going to do, because the environment is going to be much more favorable at this point in the year, as we go along and we get more expensive. There’s no doubt that folks would be putting their homes on the market but the question remains in their mind - where are we going to go?
We are in a situation right now with historically low inventory in this country. It could be the one thing that certainly
holds back the market and probably has held back the market relative to the number of people
that want to purchase a home just simply can’t because they can’t find one, or somebody
doesn’t put their home on the market because they don’t know where they’re going to go.
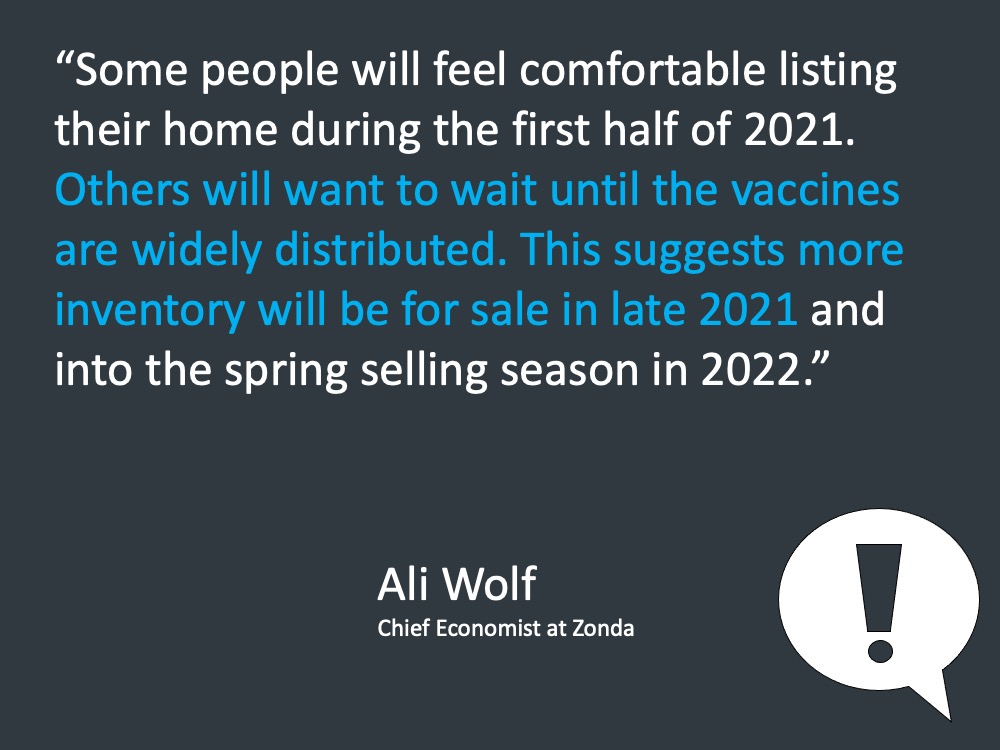
So, what are experts saying right now? More inventory is going to come back to market as
people feel more comfortable. Does it mean it’s not going to happen on the front end of this
year? Experts say some people will feel comfortable listing on the front half of this year. Probably
more in the second half of the year, and then even going into the spring of next year we’ll see
even more people feel comfortable for that
Forecasters are saying, we’re going to sell 5% more homes this year than we did in the prior
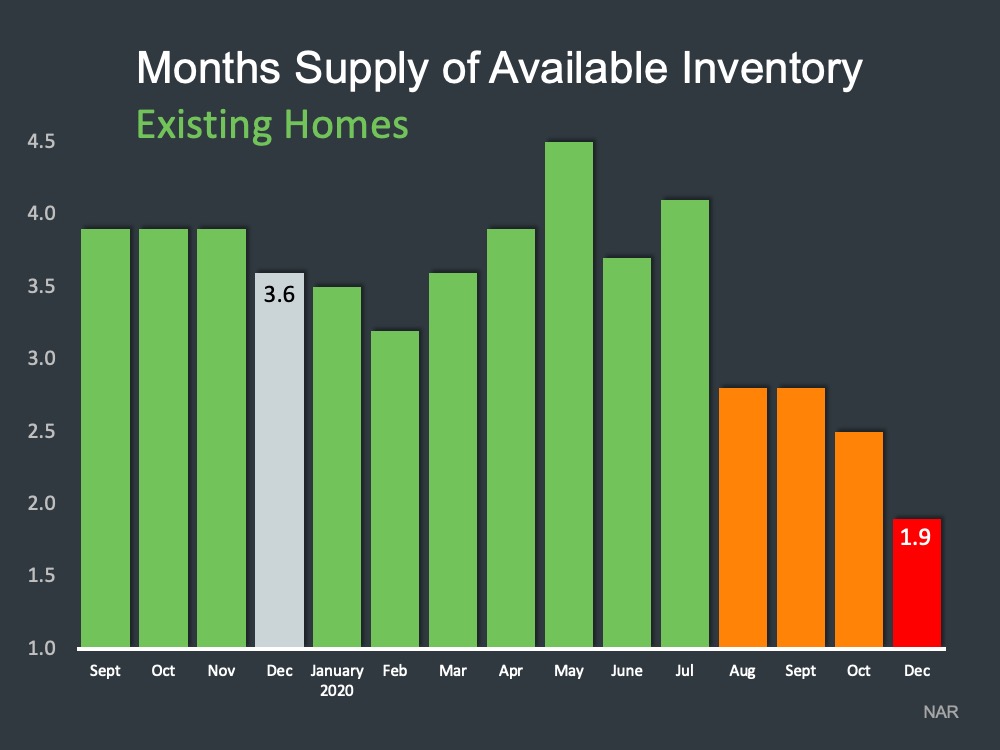
year and last year we sold more than the year before. Let’s look real quick at where we sit right now; this graph is a look at month’s supply of inventory
going all the way back to September 2019. As of December, 1.9
months of active inventory across the country. Now, to put this into perspective, last December
we had 3.6 months of inventory across the country. Even then we were back in a market that
was inventory deprived. We had an inventory challenge. And even more of an inventory
challenge where we sit today, due to all of the things that we know happened in 2020.
What we don't want to miss is that 2020 redefined home for a lot of
people. Certainly, low interest rates drove demand, there’s no doubt about that but a lot of
people needed something different in a home. The needs that they have for their families,
for each person individually, whatever the case may be, have changed. With that, they now need to go out and downsize, move up, whatever it is they need to do for their current situations and needs that they have. There is no doubt we’re seeing low inventory in the market because of that.
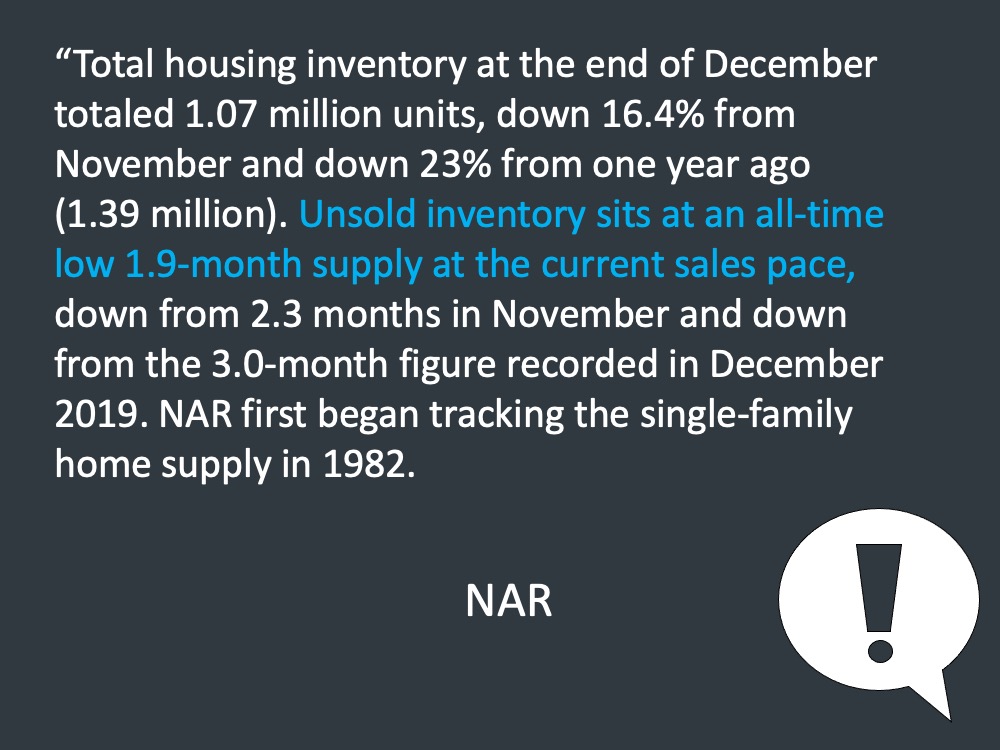
Going all the way back to 1982, we’re at the lowest point that we’ve
tracked active inventory. To put real numbers to this, there are about 320,000 less homes on
the market today than there were at this time a year ago. There’s also experts in the industry that agree, homes are being sold as quick as they come to market. The health of the
market, it’s going to depend on how quickly homes come into the market.
What are the things that are going to influence people to put their homes on the market?
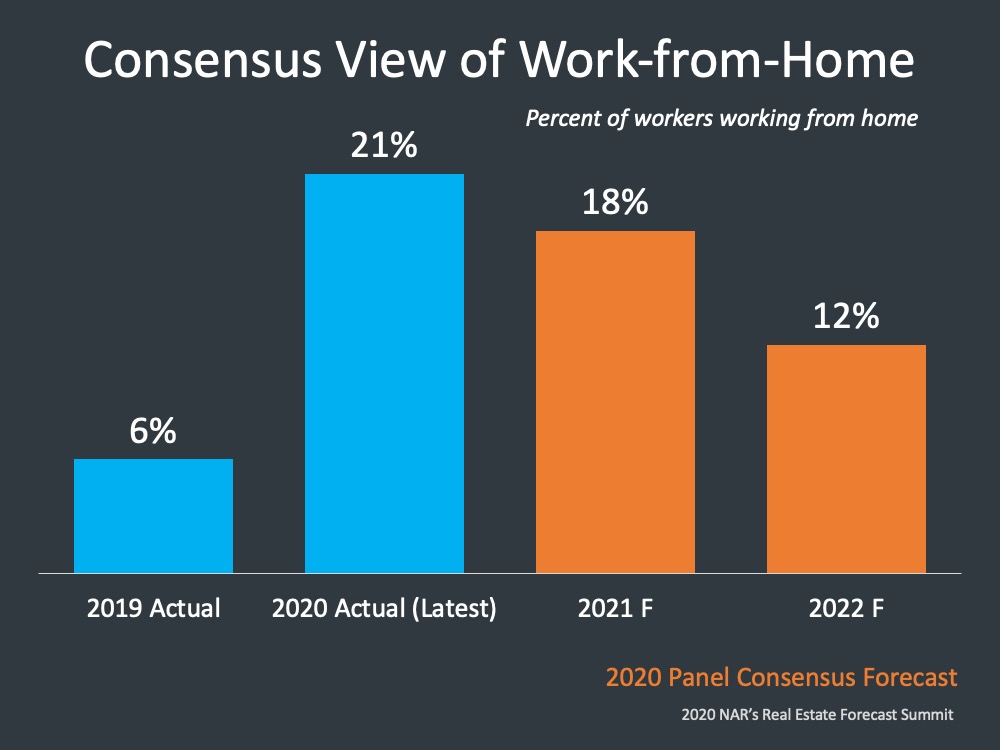
We talked about how people are going to feel comfortable. The next piece is working from home. There is a very interesting study that came out from NAR’s real estate forecast summit regarding working from home. In 2019, about 6% of the population was working from home, in 2020 that shot up to 21%. In 2021 they are estimating about 18% of people working from home and 2022 settling into about 12%.
The difference between 2019 and 2022 is there is about double the number of people working from home. There are people that this year will get clarity on what that means for them. That may mean in some cases people don't have to go back to an office, other will have a hybrid schedule and some may decide they can deal with a long commute once a week and they maybe don’t have to live where they have lived.
The other area that’s going to bring more inventory into the market is building. There will be more new construction coming to the market as the year goes on.
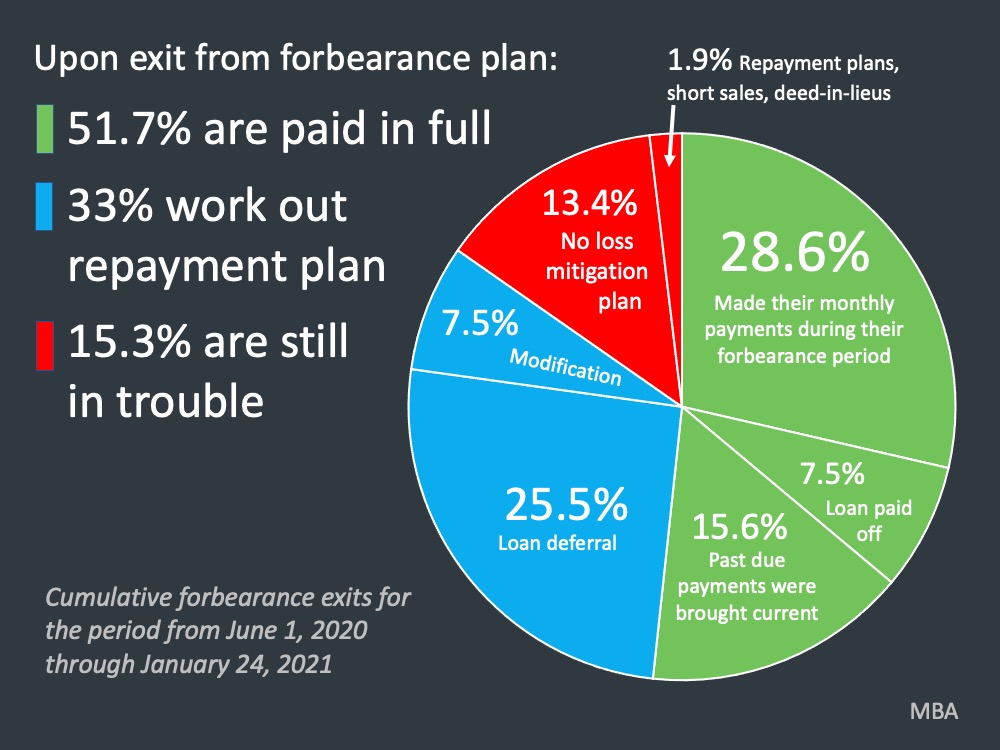
This is coming from the MBA. It’s the most recent information from June 1st to January 21st of this year. This is what’s happening from people that are coming out of forbearance.
First of all, about 2.7 million people in active forbearance right now, those that have come off, this is what’s happened. 51.7% are in that green portion of the pie - meaning they’ve made their monthly payments. They either paid off their loan through a refinance or sold the home, or paid it off and past due payments who are brought current. Many of these people are folks who ultimately may not have needed to take forbearance but did so out of precaution.
33%, one third, are in some form of work out or repayment plan. This is a loan modification, this is a loan deferral. We’re going to tack the missing payments or make up payments on the back end of the loan. We’re going to do a rate and term refi, whatever the case may be. One out of three, a significant portion of folks in this category. The bank’s are actively working with those folks to help them find a plan that works for them.
15.3% right now are still in trouble. These are people that don’t have a loss mitigation
plan and now are delinquent. These are ones that have already started a short sale, some sort
of distress sale, deed in lieu, all of those things. Those are the ones that could turn into a
foreclosure at some point. Those
are the ones that are at risk.
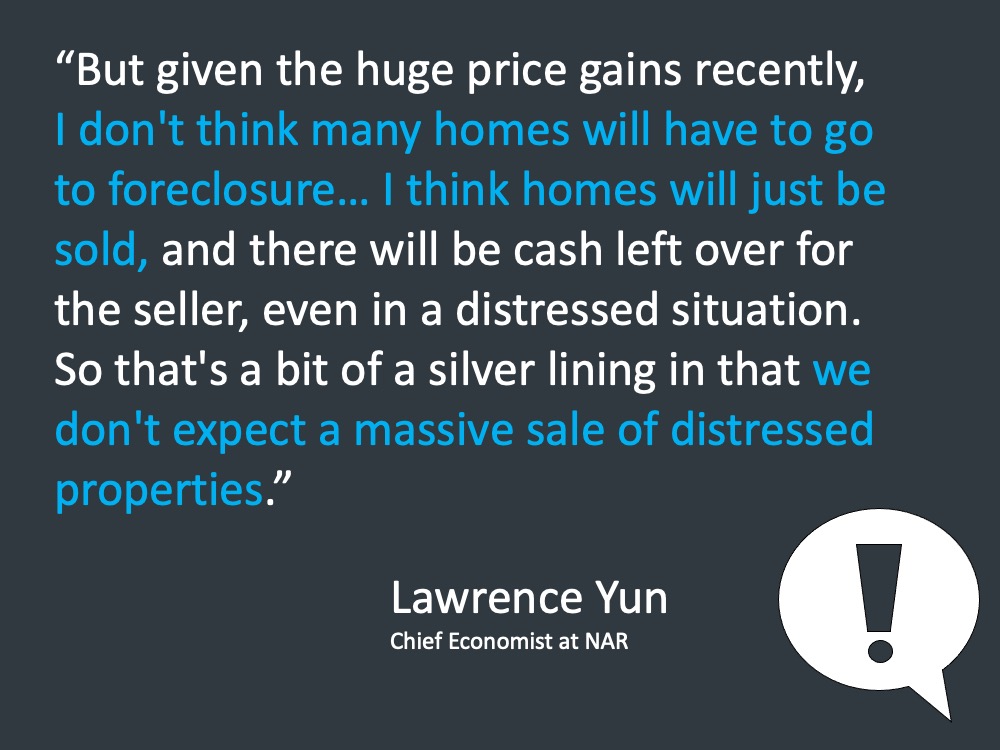
We’ve talked a lot about the equity in homes over the last year and we know equity is strong today, giving people options. Options they didn’t have back in the housing crisis which was very, very different. In the housing crash, folks were under water, they literally owed more on the home than it was worth, and they walked.
The next topic we're going to talk about is affordability in today’s market. Affordability is very much driving the demand side
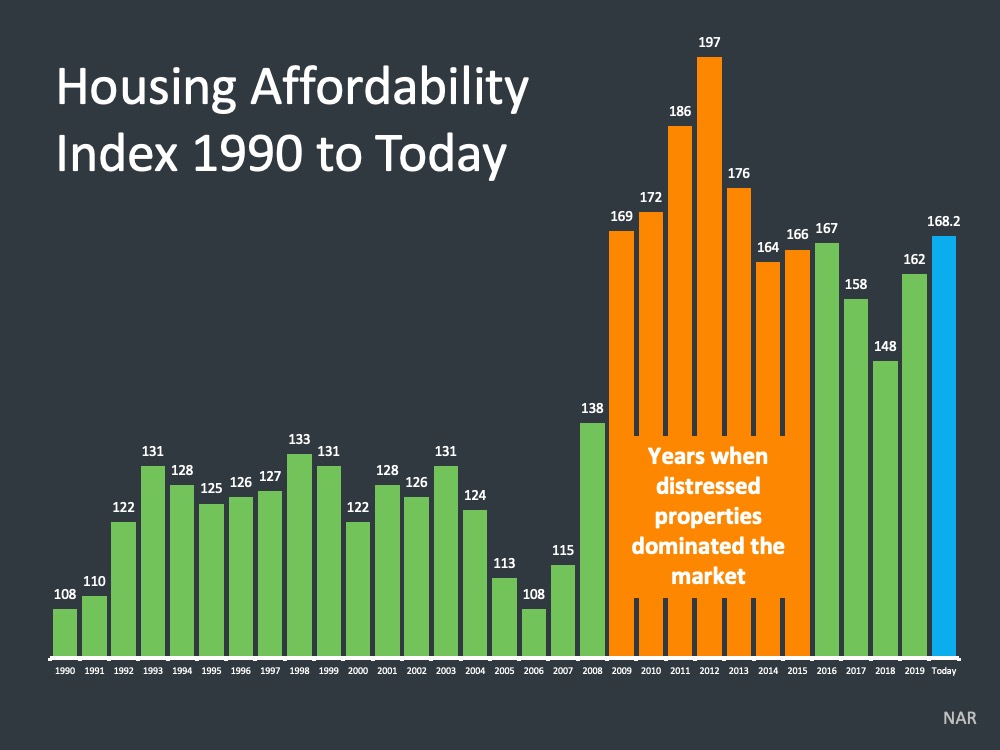
of everything that we do. We use NAR’s Housing Affordability Index, if
you remember this. The index - the higher it is, the more affordable a home is. Where do
we sit today? We sit at 168.2, the blue bar in the housing affordability index. We always
reference the years when distressed properties dominated the market because of it’s extreme
affordability. People might think well, homes aren’t as affordable as they were ten years ago. Well,
there’s an element of truth to that, but let’s not miss the fact that we’re more
affordable today than we were in the last couple of years in the housing crisis and much more
affordable than 2008 and prior.
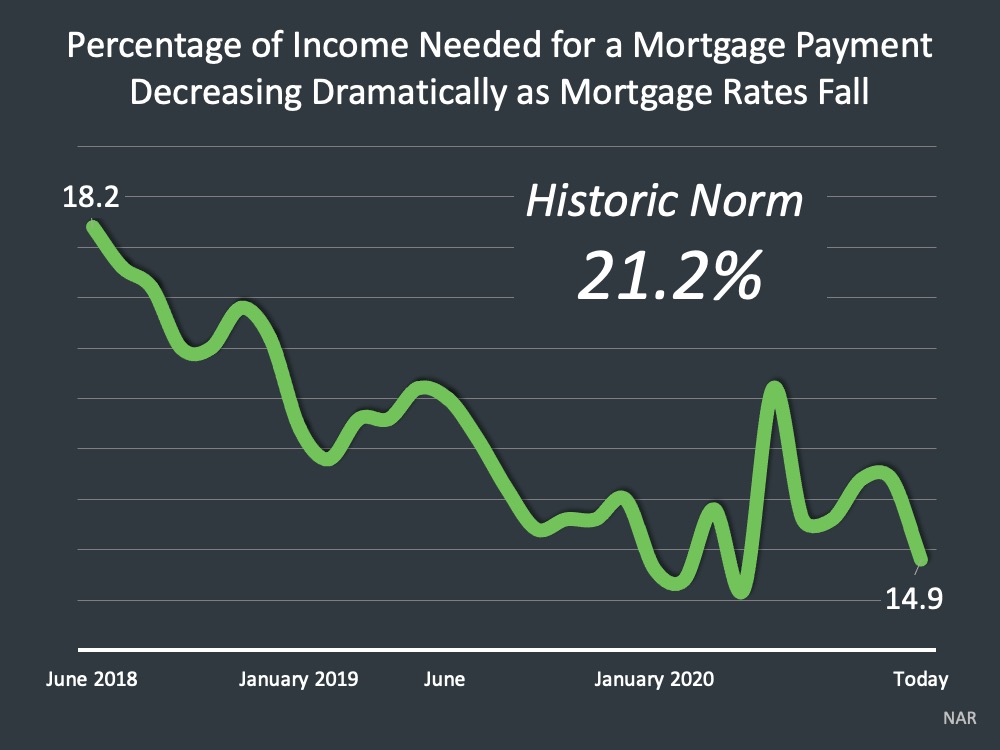
The percentage of income needed for a mortgage payment is at a historical low. That historic number is 21.2%. And today, that sits at 14.9%. That’s the percentage of income, on average, they’ve dedicated to their mortgage payment. So we don’t see that number climbing. We’re below that in a commitment to a mortgage payment from an individual on average across the country.
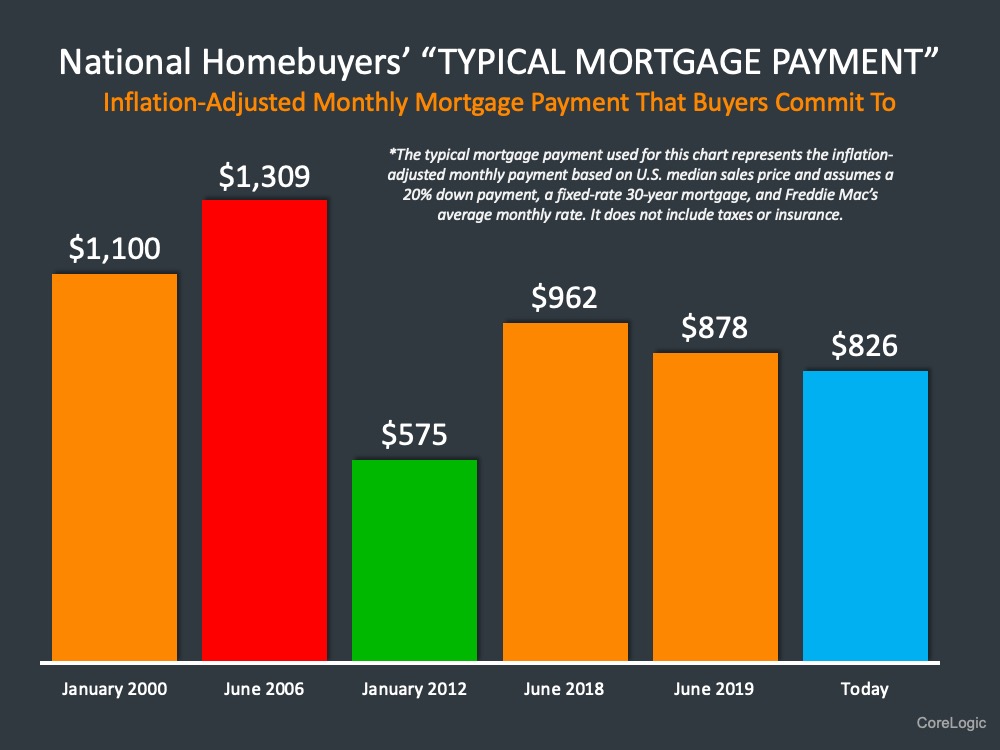
The next piece of this is, the typical mortgage payment for an individual as adjusted by inflation, and that today sits at $826. A better rate than any time except for January 2012, which if you look at a map of the crisis, the bottom of the housing crash was around January, February of 2012 and homes were extremely, extremely affordable then. Today we’re more affordable than 2018, 2019, going all the way back to 2000. Certainly more affordable than that. Very much more affordable than 2006.
What are your Biggest Concerns in 2021?
LET'S TAKE A CLOSER LOOK AT HOW YOUR TOWN DID IN THE FIRST MONTH OF 2021 ⤵️
In the Town of Plymouth, home sales decreased from 95 sales in December as we began the new year. The Average Days on Market decreased by nearly 50% slightly while the the Average Sale Price has remained at $541k over the last two months.

In the Town of Hingham, the number of new homes entering the market has continued to decrease month over month. Homes spent significantly more time on the market during January vs. December. The Average Sale Price has decreased out of the million dollar bracket for the first time in the last three months.

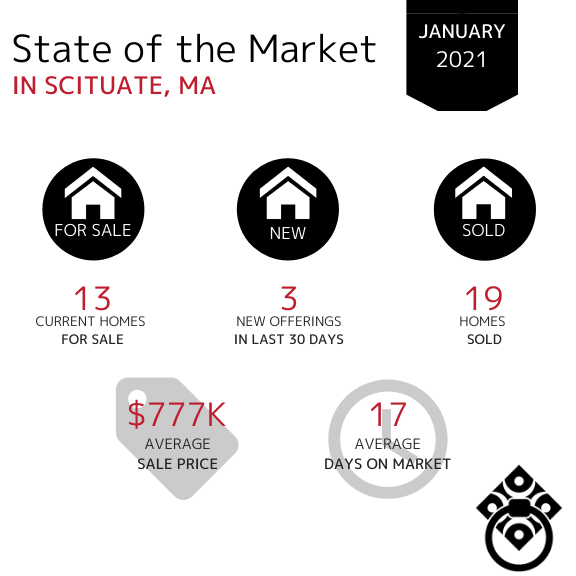
In the Town of Scituate, the Average Sale Price remains in the $700k bracket however it has increased by $70k. Home sales decreased in January, down from 37 homes sold in December.
In the Town of Marshfield, the number of homes sold decreased slightly over the last month in comparison to December. Properties spent much less time on the market during January than they did in December. The Average Sales Price has continued to increase month over month from $591K in November and $607K in December.

In the Town of Kingston, the number of new offerings has increased slightly vs. the 3 homes available in December. The number of homes sold is remaining consistent month over month and the Average Sale Prices have remained consistent in the mid-$500K range.

In the Town of Duxbury, the Average Sale Price of homes had drastically increased in December and has only seen a slight decrease in January from $982K to $857K. Available inventory has increased ever so slightly and there were only 3 new offerings in the last 30 days. The Average Days on Market continued to decrease by 50% just as they did in December.

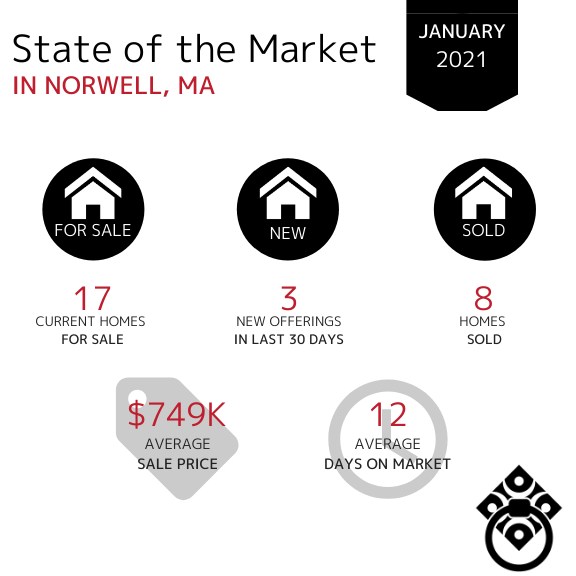
In the Town of Norwell, the Average Days on Market have decreased from 51 days in December to just 12 in January showing that homes were spending much less time on the market. There is limited inventory in many towns, including Norwell however the number remains consistent month over month. The number of homes sold remain consistent and the Average Sale Price decreased out of the million dollar bracket significantly in January.
In the Town of Cohasset, the amount of available inventory has remained consistent over the last four months which shows a steady market. The number of days on market has also remained consistent over the last 2 months. The Average Sale Price increased from $1.2mil in December.

In the Town of Hanover, the number of homes sold remained consistent at 10 homes from December to January. The Average Days on Market has decreased and the Average Sale price has increased by $135,000.

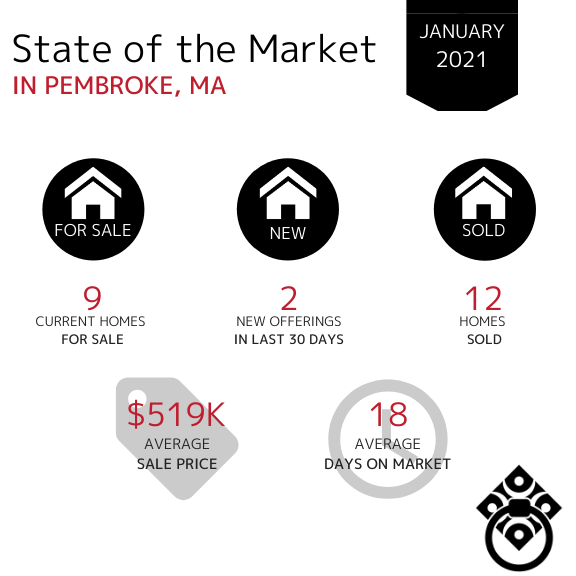
In the Town of Pembroke, the current amount of available inventory is still very slim. There have been only 2 new offerings within the last 30 days which could likely be attributed to the overall lack in available inventory - sellers are not ready to place their homes up for sale. The Average Days on Market continues to remain consistent, just under one months time. The Average Sale Price has increased from $486K in December to $519K in January.
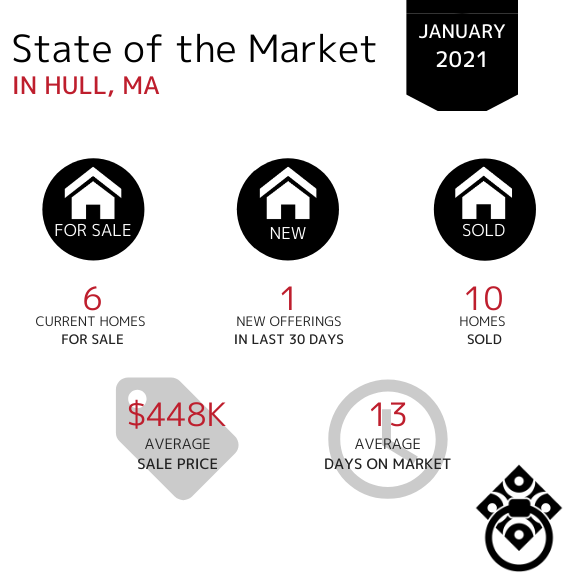
In the Town of Hull, the number of homes sold remained consistent throughout the last 3 months. Homes entering the market have remained consistent and there is still a limited amount of available inventory.
The Average Days on Market have dramatically decreased from around 80-90 days over the last few months to only 13 days in January. Similarly, the Average Sale Price has also decreased significantly in January.
In the Town of Bourne, the amount of available inventory has continued to decrease month over month as we ended the month of January. The Average Days on Market has decreased for the first noticeable time since October which tells us that the buyer demand is strong and they are actively purchasing the homes that are available. The Average Sale Price has remained in the mid-$600k range and the same amount of homes continue to sell month over month.

In the Town of Sandwich, the Average Days on Market increased while the number of homes sold dropped from 37 in December to 19 in the month of January. Inventory remains fairly consistent with only a slight decrease in available homes for sale.

In the Town of Mashpee, the Average Sale Price is still under the million dollar bracket, at a lower average prices than we saw in October at $801,000. The Average Days on Market have increased from 62 in December. The number of homes sold has decreased from 28 homes in December to just 14 in January.

In the Town of Falmouth, the Average Sale Price has decreased from $955K in December back to sale prices seen in October/November of last year. With limited inventory in most towns, there are still plenty of new homes entering the market as we moved through the month of January, more than most other towns were able to say. The number of homes sold has decreased although not drastically month over month.

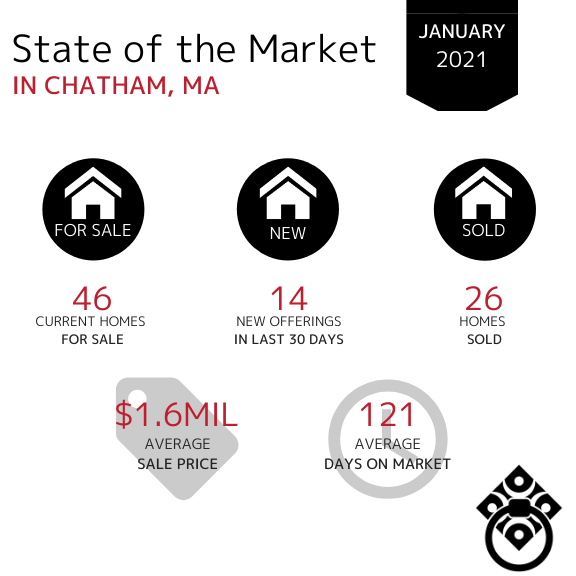
In the Town of Chatham, home sales decreased from the first time since October, down from 34 homes sold in December. The market in Chatham is remaining consistent with throughout the last three months. The Average Sale Price has remained in the million dollar bracket over the last 5 months with a another increase from $1.5M in December. Homes have spent more time on the market in the month of January than they did in December.
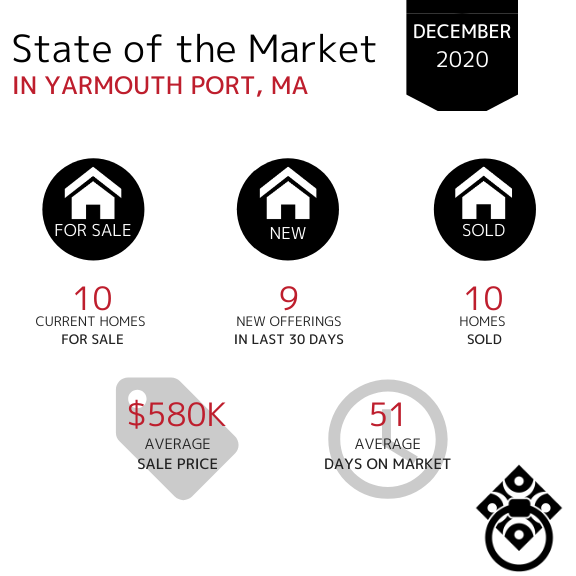
In the Town of Yarmouth Port, property sales have decreased slightly since December. The Average Days on Market decreased as well while more homes also entered the market in the month of January.
If your town wasn't included in this report,
click here and let us know. We'll be happy to get you that data!
Learn How Much Equity Your Home Has Gained...
VIRTUAL SELLING
SEARCH FOR HOMES
*Market Information obtained from MLSpin, Cape and Islands MLS and Keeping Current Matters*


