


Our team has been crunching data from the South Shore and Cape Cod Association of Realtors® Multiple Listing Services (MLS) every day for the last seven weeks to help our clients and community better understand the impact of COVID-19 on our local market sine Governor Baker put the Stay-AT-Home order into effect.
Last updated 5/1/20
This report is for single family homes in Plymouth County and Barnstable County. Please note Condos, Multi-family homes and land are excluded.
New Listings: new listings inventory has decreased by 27.39% from this time last year. In 2019 - 1,289 listings were available in Plymouth County as of May 1st whereas there are only 931 homes on the market as of May 1st. There was a 19.6% decrease in the number of new listings in Barnstable County.
Price Changes: Sellers are not negotiating. Almost 35% less Seller this year have adjusted their asking prices during their selling cycle than in 2019. Price change data is currently unavailable for Barnstable County.
Pending Contracts: as of May 1st, there is a decrease in the number of pending sales of 16.55% from what the numbers were during the Spring Market in 2019, average days on market remain about the same. Pending data is currently unavailable for Barnstable County.
Closed Sales: Winter sales and a strong start of 2020 have helped Sold data remain almost unscratched, with only a 1.33% decrease year over year in Plymouth County and a 4.3% decrease in Barnstable County.
Mortgages: mortgage rates have begun to stabilize over the last few weeks as the market searches for direction. Banks continue to watch from the sidelines for forbearance requests to peak. As a result, the only readily available mortgage types continue to be Conventional (Fannie Mae and Freddie Mac), Government (FHA and VA), and A-Paper Jumbo (albeit with tighter credit standards than before).
We are here to help: while there is a lot of uncertainty and fear, and the real estate market and economy overall is experiencing an acute shock, we will get through this together and come out stronger on the other end. We are here for you to answer any questions and help you find solutions and possibilities during this challenging time. Please do not hesitate to contact us at [email protected] or call 508-746-0033.
DIFFERENCES BETWEEN 2008 AND 2020
#1.. INVENTORY
Entering this year, the biggest challenge we were prepared for in the
housing industry was inventory, literally not enough homes on the market for the number of people that
wanted to buy those.
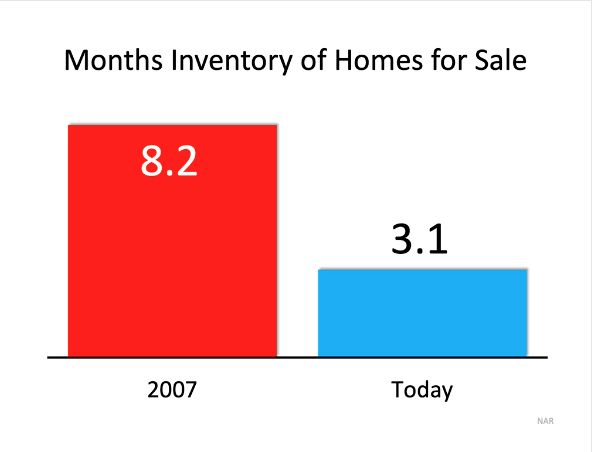
So, if we take a balanced market of six months and we look back to
2007, we know there were just over eight months of supply of inventory on the market leading us to
above six months being a buyer’s market and below six months being a seller’s market.
Today, we’re
at 3.1 months of inventory on the market. We literally don’t have an oversupply of homes on the market
for people that want to buy them, much different. Oversupply led to the issues that we went into 2008
and faced as an industry.
DIFFERENCES BETWEEN 2008 AND 2020
#2.. EQUITY
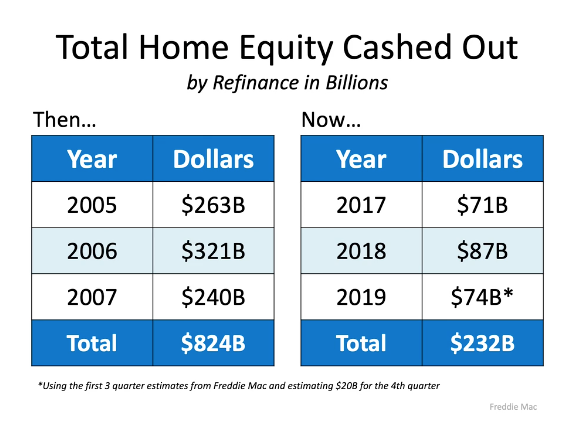
The next thing we want to look at is home equity and how consumers are using their equity then
and now. This gives a really good picture of 2008 and the three years leading up to 2008 you see on
the left side of this image. Eight hundred and twenty-four billion dollars was cashed out as cash out refis during
that time.
We know the three years leading to today that number is 232 billion, a fraction
of what it was back then.
Back then, people were using their homes almost as an ATM, taking equity out
of their homes, putting it into depreciating assets, buying vacations, going on trips, doing things,
financing lifestyle thinking this is never going to end. This shows you how consumers are treating equity
today, and it’s very different than 2008.
What we also know is that 53.8 percent of all the homes in this
country have at least 50 percent equity. We know that because 37 percent of the homes are owned free
and clear, and then when you take the remaining homes, 26.7 percent of those have at least 50 percent
equity, which gives us this number of 53.8 percent of homes have equity, a very different position than
2008.
In 2008, when we had homes leveraged to the hilt, that home loses a little bit of value
and you literally owe more on the home than what’s it’s worth, people walk away.
People aren’t walking
away today with the equity they have in homes, $50,000 or $100,000 of equity in their home. They’re
going to stay there, and they’re treating their homes very, very differently than what we saw in 2008.
DIFFERENCES BETWEEN 2008 AND 2020
#3.. MEDIAN INCOME
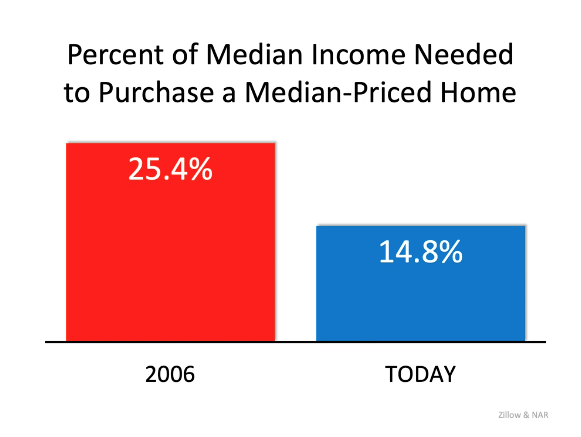
The percent of median income needed to purchase a median-priced
home, and what we know pre-bubble is that number was a lot higher than what it was today.
Back in
2006, just over 25% of someone’s income was dedicated to their home and their
housing need. Today, that number is just under 15% of income dedicated to the
housing need, and we know again, a very different picture.
DIFFERENCES BETWEEN 2008 AND 2020
#4.. UNEMPLOYMENT
There’s a lot of confusion
out there. We do
have one challenge that is, and that’s the job loss. Ten million people lost their jobs the two weeks before Tuesday April 7th. Now, we're going to take a look at those numbers in a little deeper context.
This is what of the first 700,000 let’s take a look at who they are:
- Number one, 59.5 percent are food service and drinking places, meaning they’re servers and bartenders.
When the restaurants open back up, all of them go back to work immediately. - Construction workers at 4.1%, the new construction was finally starting to take off, and all of a sudden, they got hit with supply chain issues, etc. Those people will be back to work.
- Healthcare office workers at 6.1%, meaning office workers in dentistry, specialty offices and doctors offices - they’re all going to go back
to work. - Childcare workers (2.7%) will be back to work. If we're spending three months or longer with our kids at home, we’re
definitely going to want to get the childcare workers back to work. - Temporary help services (7.1%), well, obviously since a business is not working all the people that
work in the temporary services to help that business staff itself, they’re gone. - Retail trade (6.6%), all the stores
are closed. Once they open back up, those people come back in. - Lastly, the accommodation
industry at 4.1%, the hotel industry, and obviously they might not rush right back in, but they’ll be back in. - All the other jobs not in those categories make up 9.8 percent of the 701,000 that were originally laid off.
So, we can see that the vast majority, over 90 percent, will likely get their jobs right back, but again this report was done on March 14th.
So, it doesn’t include the second
half of March, and many of the ten million were in the second half. Will they be the same type of
workers? No, not exactly, but that data will not be out until May 8th. But understand that the vast majority of the people laid off are
going to come back to work, and we’ll go back to the V-type type of recovery.
The headlines are going to be ugly about the unemployment rate on May 8th, actually the
unemployment. Yeah, the May 8th unemployment rate will come out. It will be ugly. The Labor
Department numbers on how many people are losing, collecting unemployment that number is still
going to be ugly.
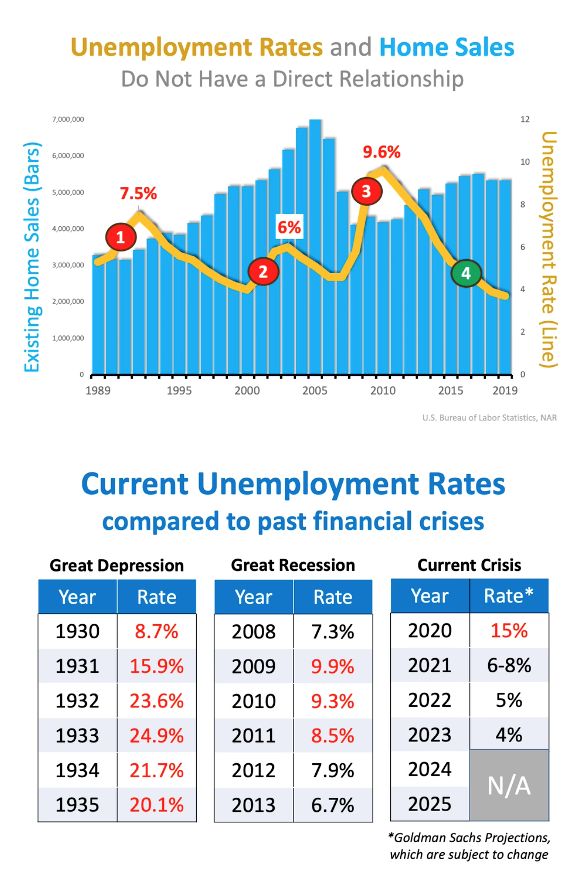
Take a look at the graph to the left. Going all the way back to 1989, and
what we see is there is no direct relationship between the unemployment rate and the number of houses
sold, and we give you three instances of that.
- First, in the early 1990s, the unemployment rate went up to
7.5 percent. Home sales continued to increase. - In the early 2000s, the unemployment rate
went up to six percent, and home sales continued to increase somewhat dramatically. - Then when the housing crash occurred, the unemployment rate shot up to 9.6 percent, and yes, home sales fell, and we're sure that has a major piece to do with it, but also understand that was also the time when the banks just shut off lending. Even those we knew were mortgageable, couldn’t get a mortgage because the banks were so tight in their new standards.
For the last many years, the unemployment rate has been dropping
like a rock, but look at home sales. They remain flat. So, really, there’s not a direct correlation. We understand that unemployment could have an effect, and
we’ll look at that effect as we look at how many people, in fact, do lose their jobs. And we’ll look at
who those people are and how quickly could get those jobs back.
DIFFERENCES BETWEEN 2008 AND 2020
#5.. MORTGAGES
- Banks continue to watch from the sidelines for forbearance requests to peak. As a result, the only readily available mortgage types continue to be Conventional (Fannie Mae and Freddie Mac), Government (FHA and VA), and A-Paper Jumbo (albeit with tighter credit standards than before). For small to mid-sized banks, the concern continues to be how much capital needs to set aside to reserve for non-performing loans. This has made them shy to lend which has created a void for alternative products that typically have more accommodating underwriting standards.
- In the Non-QM space the secondary market continues to be frozen, therefore bank statement loans and loans for credit challenged borrowers continue their hiatus. On the bright side, there is a rumbling within the mortgage community that one of the major Non-QM players is getting ready to re-enter the market. This is a very good sign that the appetite for Non-QM loans still exists and that institutional investors of such products are lying in wait, looking for the right moment to re-enter the market while they reconsider underwriting guidelines to account for the new normal.
LET'S TAKE A CLOSER LOOK AT HOW YOUR TOWN DID IN THE MONTH OF APRIL ⤵️
In the Town of Plymouth, home sales continued to increase through the month of April. Buyers are still actively securing homes despite the necessary precautions put into place during the COVID-19 pandemic.
Homes are still entering the market however, the number of new offerings decreased in April vs. March. Homes are taking slightly longer to sell as we navigate through the global pandemic, the average days on market increased from 75 in March to 98 in April. The Average Sale Price increased in April vs. March by $23,000.

In the Town of Hingham, the market has remained extremely consistent from February through April. The only significant change was in the decreased number of days on market. In March the average days on market were 81 vs. 37 in April. The Average Sale Price of homes sold in April remained at $1.1M which tells us that home values are remaining strong.

In the Town of Scituate, the Average Sale Price increased by $52,000 in April. Homes are selling much slower through the month of April, up from 85 average days in March. The number of homes SOLD also decreased in April which shows a slowing market however homes are still entering the market.

In the Town of Marshfield, the Average Sale Price of homes sold has continued to increase. Properties are selling at a faster pace - in just under 2 months. Home Sales and new homes entering the market have remained consistent month over month indicating a steady market.

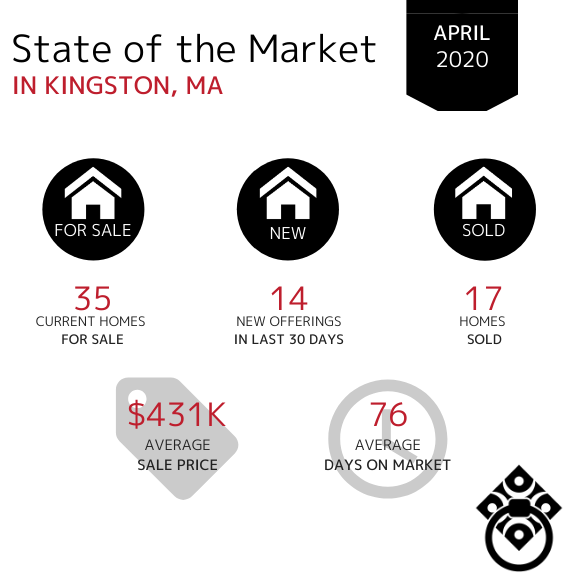
In the Town of Kingston, available inventory has increased slightly however there has been no significant changes. The Average Days that homes spent on the market increased. The Average Sale price has decreased into the mid $400,000s.
In the Town of Duxbury, the Average Sale Price of homes increased into the million dollar bracket in April. Available Inventory has increased slightly while the Average Days on Market decreased from 87 to 69 in April. This indicates that buyers are serious and property values have increased as the Spring market continues.

In the Town of Norwell, the average days on market decreased from 87 in March to 46 in April showing a strong sellers market. There is still a lack of available inventory as we're continue into the Spring. The Average Sale Price has continued to remain steady month over month.

In the Town of Cohasset, the Average Sale Price has continued to remain in the million dollar bracket. The number of homes SOLD decreased in April vs. March. The Average Days on Market have remained consistent.

In the Town of Hanover, the number of homes SOLD have increased slightly in April. The Average Days on Market significantly decreased from 136 in March to 81 in April which indicates an uptick in the market in Hanover.

In the Town of Pembroke, the amount of new offerings in the last 30 days have increased in the month of April and the amount of total homes for sale has increase as well from 19 in March. The Average Days on Market decreased by 25 days since March. The Average Sale Price has remained consistently in the mid-high $400,000s.

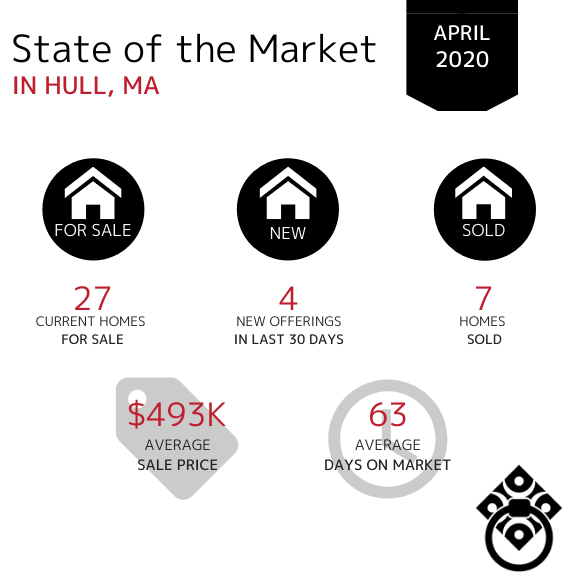
In the Town of Hull, the number of homes SOLD has decreased slightly in April. Buyers are still active however, with a lack of inventory buyers don't have much to choose from. Homes remained on the market for a much shorter time than they did in March (111 days). The Average Sale Price has increased by $113k.
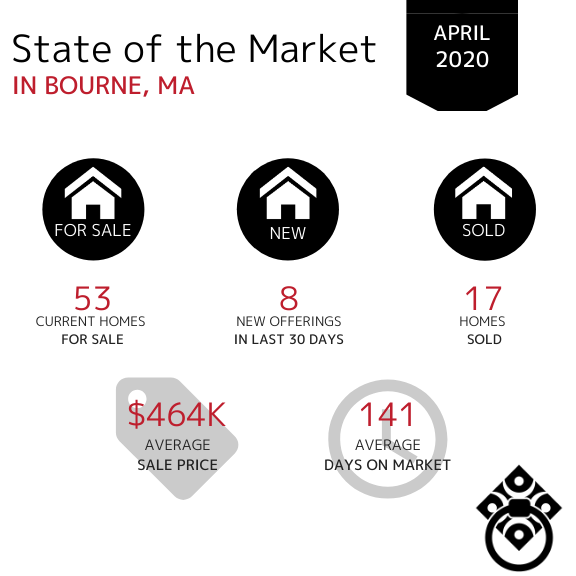
In the Town of Bourne, the amount of available inventory has remained consistent however the number of new offerings in April was only 8. This tells us that homeowners are not placing their homes on the market in the same capacity they were in March. The number of homes SOLD remained at 17 sales month over month. The Average Sale Price has gone down from $523k into the $400k bracket. The Average Days on Market have continued to increase which shows that homes are spending a longer amount of time on the market as this point in time.
In the Town of Sandwich, the Average Days on Market have continued to increase while the number of homes SOLD have decreased. The Average Sale Price has remained fairly consistent from February through April - remaining in the mid $400,000s. Available inventory has slightly decreased from March. This indicates that fewer Sellers are still motivated to place their homes on the market during the Spring market.

In the Town of Mashpee, the Average Sale Price has decreased from $726k in March to $535k in April. The Average Days on Market have remained consistent month over month however the number of homes SOLD decreased which indicates that properties are selling at a fastethe same rate but a lower volume.

In the Town of Falmouth, the Average Sale Price has decreased from $1.2 million to $679k in April. The number of new homes entering the market in April was down by 50% compared to March which indicates that Sellers are holding off from putting their homes on the market during what is typically the hottest time of year to sell. The number of homes SOLD also increased indicating a that Buyers in the Falmouth market are actively looking and securing housing even with COVID-19 precautions in place.

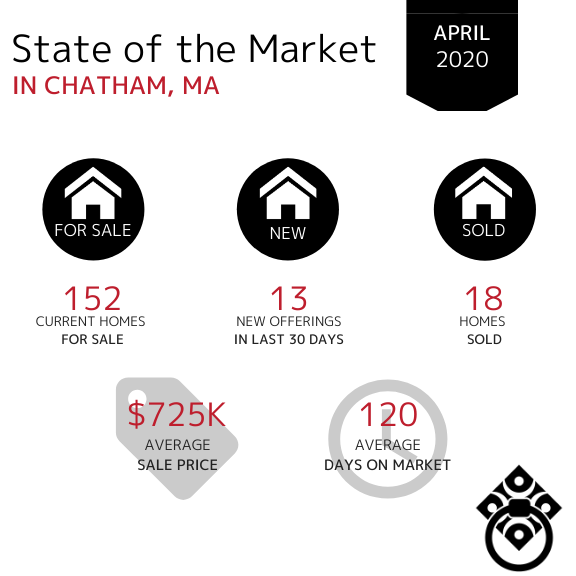
In the Town of Chatham, home sales increased during the month April. The Average Sale Price has decreased from the million dollar bracket as the month of April came to an end. The Average Days on Market continued to increase in April as well. New homes entering the market in April had slowed down dramatically from the amount in March (31).
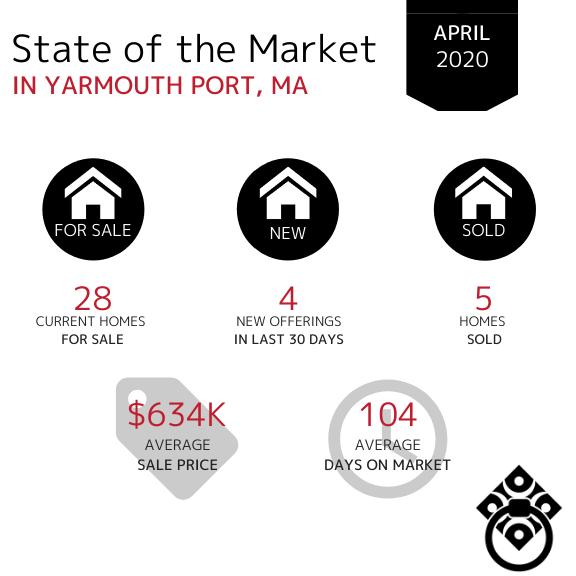
In the Town of Yarmouth Port, property sales are down by 50% in April. The Average Days on Market have decreased significantly since March however there is a lack of new inventory entering the market which will likely cause the average days on market to rise again.
If your town wasn't included in this report,
click here and let us know. We'll be happy to get you that data!
VIRTUAL SELLING
SOLD DURING COVID-19
*Market Information obtained from MLSpin, Cape and Islands MLS and Keeping Current Matters*


