


.png)
Each month we crunch data from the South Shore and Cape Cod Association of Realtors® Multiple Listing Services (MLS) to help our clients and community better understand the state of the local real estate market as we continue into Q2 of 2021.
This report is for single family homes in Plymouth County and Barnstable County. Please note Condos, Multi-family homes and land are excluded.
New Listings: New listings inventory continues to remain down by 63% from this time last year. In 2020 - 847 listings were available in Plymouth County as of 4/13/20 whereas there are only 313 homes on the market as of today. There was a decrease of 25.4% in the number of new listings in Barnstable County as compared to 2020 (459 less homes available).
Price Changes: It continues to be a Sellers market due to limited inventory throughout Plymouth County. Sellers are still not in a market where they need to be negotiating and they're are getting more money for their homes than they would have at this time last year. 307 homes changed their prices last year vs. 134 YTD. Price change data is currently unavailable for Barnstable County.
Pending Contracts: As of April 13th, there are nearly the same amount of listings that have gone under contract with sales pending compared to last year - only a variance of 6 homes. The average days on market has continued to decrease as demand remains high in the current market. Pending data is currently unavailable for Barnstable County.
Closed Sales: The market has continued to be extremely active even with limited inventory. That has not stopped as we continue through the first quarter of 2021 however with less inventory, there has been fewer sales vs 2020. As of April 13th home sales are up by 3.25% 2021 vs. 2020. The number of listings sold in Barnstable County is up 8.3% as of 4/13/21.
Mortgages: Mortgage rates have increased slightly and are now beginning to level out however, they still remain lower than usual with a strong real estate market. Readily available mortgage types continue to be Conventional (Fannie Mae and Freddie Mac), Government (FHA and VA with tighter FICO score requirements), USDA, Mass Housing, Renovation and Jumbo (although some lenders don't have access to some of the bank investors that are doing them). First time home buyer rates remain low right now and many are finding that they are qualifying for Conventional Loans setting them at a better advantage for winning offers.
We are here to help: We are here for you to answer any questions and help you find solutions and possibilities during this insanely busy market that we are experiencing. Please do not hesitate to contact us at [email protected] or call 508-746-0033.
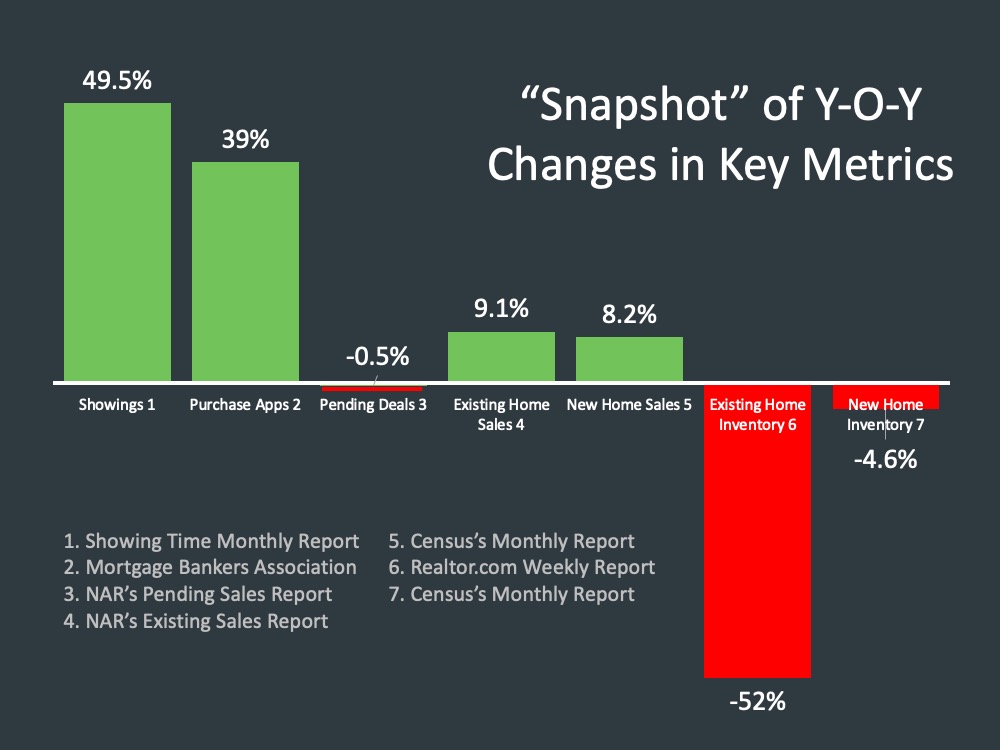
Year over Year Snapshot
Here is a snapshot of the market year over year. There is a lot of noise about a lot of different things in real estate right now but if we look at the snapshot of year over year
metrics we can see showings are up 49.5% year-over-year. A lot of people getting out and wanting to
look at homes across the country. Purchase applications are up 39%.
We’re in an interesting period right
now where we’re going to start seeing some of these metrics shoot up year over year because this is
measuring the weeks when we first started the lockdown last year. So seeing significantly more purchase
applications because nobody was applying to mortgages or leaving their house, for that matter. If we look at pending deals, this is actually measuring February. Those down just slightly, but existing
home sales and new home sales both up, knocking at the door of almost 10%.
Where is the issue?
The issue is in inventory. We know that across the country it’s something that continues to plague us as
an industry. But overall, if we look at some of the other metrics year over year, a very strong market as
we head into the spring in April.
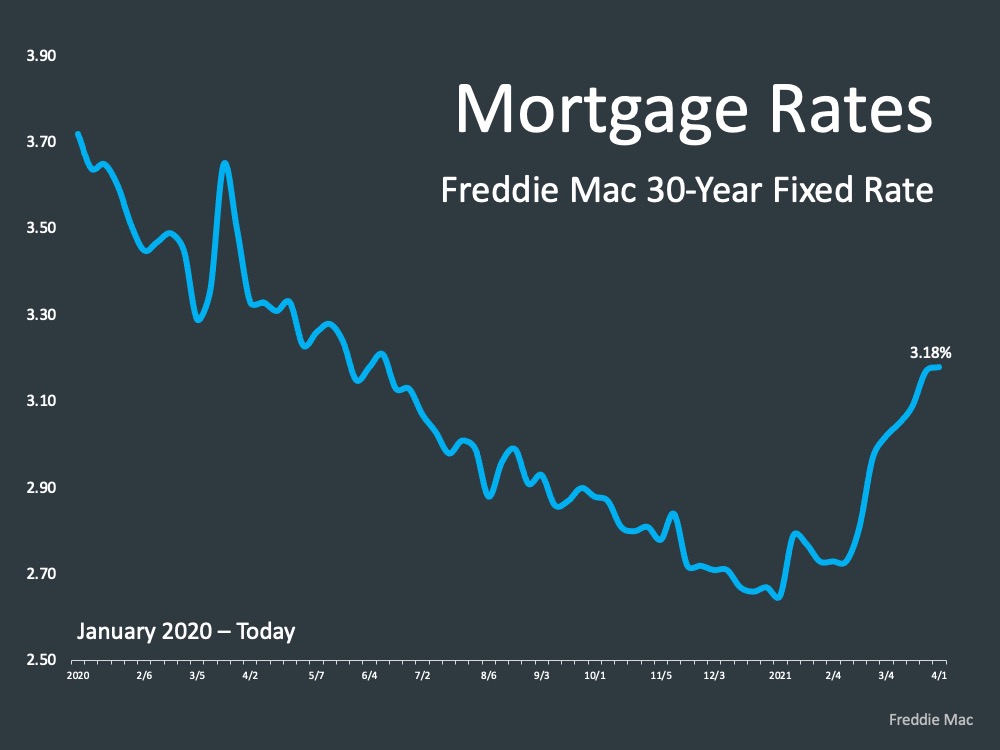
Mortgage Interest Rates
The other big thing that’s been going on in real estate is we’re seeing a rise in interest rates. The average
30 year fixed as recorded by Freddie Mac at 3.18% right now. To put that into perspective, we saw
towards the end of the year dipping down into the middle twos. This puts us back somewhere around
June of last year where we saw this rate environment start to slide down to the twos - historically low interest rates. A new low in the average 30
year fixed and it’s starting to come back up and really seeing the return of those rates creeping a little bit
higher as the economy improves across the country.
“Home sellers and homebuyers have gotten really used to extremely low rates. Rates even
in the 3% to 3.4% [range] remain extremely affordable by historic standards.” - George Ratiu, Senior Economist at realtor.com
We’ve been talking about how rates are going to continue to rise as the economy improves. We do expect in the
coming month that we will get estimates and forecasts for what experts are saying the remainder of this
year will be for the rate environment and some of those are likely going to be up-ticked. We’ve seen
Goldman Sachs saying as high as – they’re looking at the ten year treasury saying that we could be at
three and three quarters by the end of the year. Some are saying more on the lower end of
that, three and a quarter. What do we know? We know it’s probably not going to be where it’s at today and we’ll continue to see interest rates rise as we
go throughout the year and the economy improves.
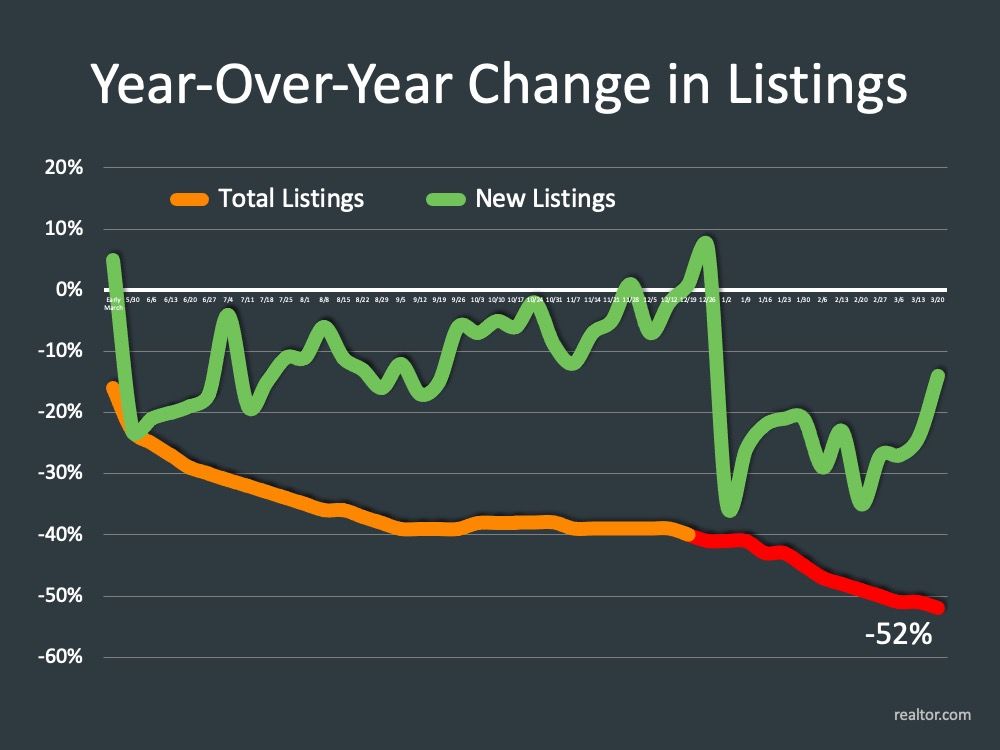
Inventory
Low interest rates have many people running in to buy homes and has caused the inventory challenge across the country. This is the snapshot of new listings coming into market as compared to the total listings in the country.
Right now across the country on average, we’re down about 52% year over year in the number of homes that are available on the market for those that want to buy them. We are seeing listings coming to market and we certainly want to see that continue to grow as we move into a strong spring market and more and more people are putting their homes on the market but right now a deficit across the country.
If we look at this map right here, we can see the majority of the country in this red, some states in this dark red, in 60+% down year-over-year. No doubt that low interest rates, the pandemic, and other pressures around housing have caused this issue of low inventory. ⤵️
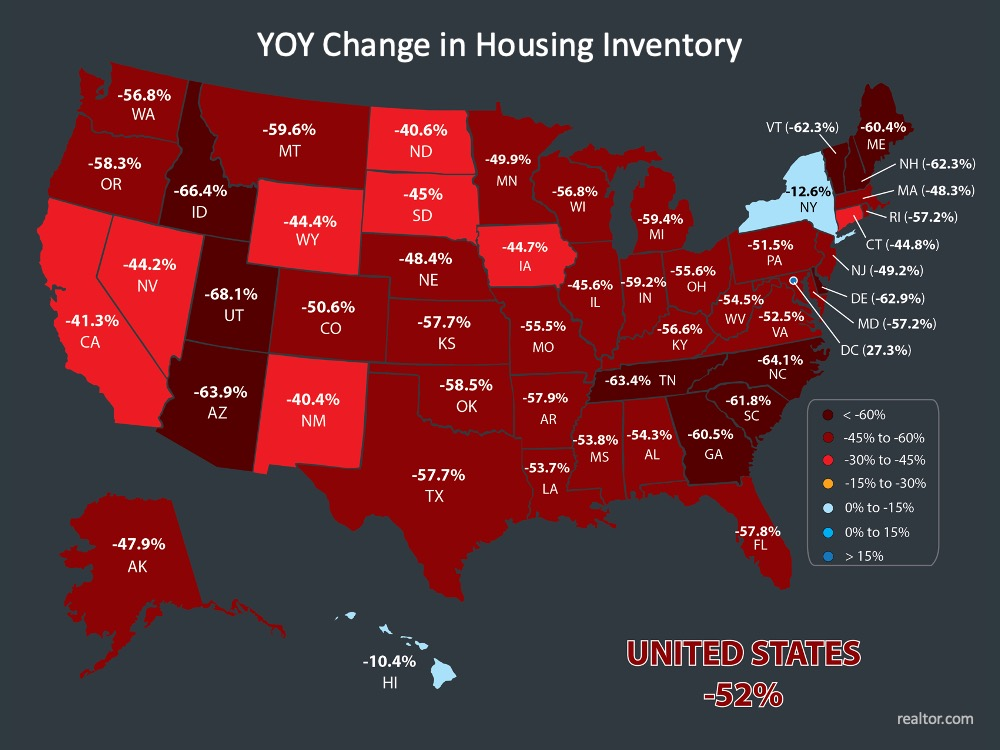
Experts are forecasting inventory to come back into the market the second half of the year and more as people get more comfortable. Those that are affected by the pandemic economically and having to list their homes, builders building new homes, etc. However as we stand right now, the inventory situation across the country is pretty dramatic in lack of available homes for sale.
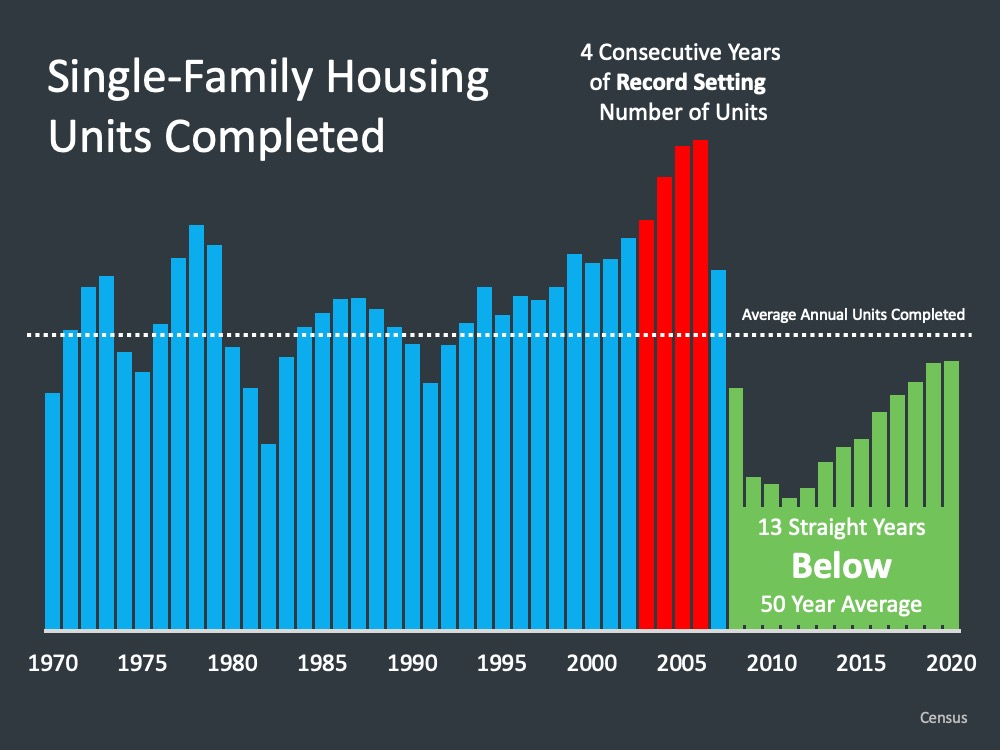
One important piece of information we want to share with you is that single family housing units that have been completed, for the last 13 years they’ve been below the 50
year average. If we go back in time you see the red bars in the middle which is around 2004, 2005, 2006. Some of the record setting times in real estate. Four consecutive years of record setting number of
units being built. There were three years in this country when more than a million and a half homes were
built. That never happened before and it never happened again.
What we know in the
housing crisis is builders were very much at the center of real estate and construction lending dried up. Following that time, builders have not been
bringing to market the number of units to keep up with population growth. If you look back in the 70s
and 80s, more homes were built in this country back then than there are today.
This image here
simply and effectively conveys that message to everyone that we serve that we’re in a deficit here
because the number of new units coming to market has not been there.
Now, builders are
building, permits are up right now. They’re concerned, obviously, about rising cost in the new home
market but what we need is more builders to build more homes to give people that want to own a home, a
chance to do so.
Equity
Some of the big things that are bearing in on our market right now relative to low inventory prices rising, one of the questions that’s come up over and over is, are we seeing this cash out refinance issue?
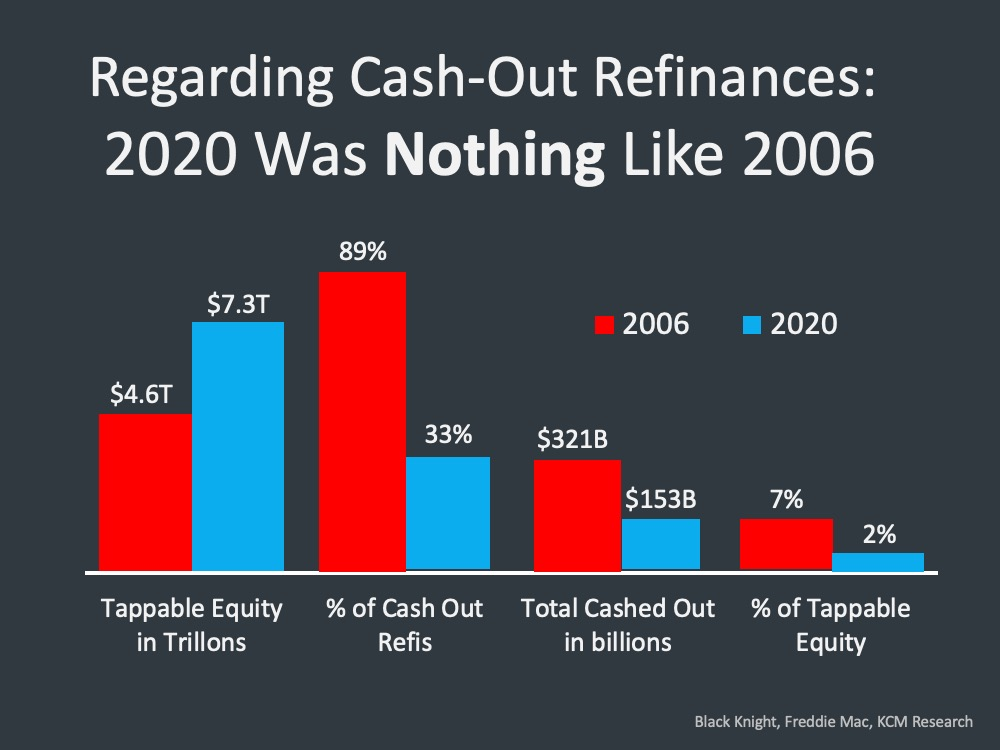
First, let’s look at this; home equity cashed out by refinances in billions. $153 billion last year cashed out as cash out refinances in this country. Back then at the height of the market, $321 billion cashed out.
Nowhere near what it was back then but yes, at the highest levels since the crash and so that part is true but in context, you have to understand where it was back then and we’re nowhere near where it was back then relative to the amount of cash out refinances being transacted across the country.
What this has caused is the amount of tappable equity that US mortgage holders have has caused it to surge. Tappable equity is defined as the amount available for a home owner to access before hitting a maximum 80% combined LTV - loan to value.
LTV in equity in homes is surging right now due to the way that homeowners have handled their equity over the last ten years and not accessing it. Back then, tappable equity was knocking on the door of $5 trillion and where that stands today is over $7 trillion. This is something that we want to continue to look at.
We were in an upward trending interest rate environment back in 2006 in the first half of the year. So
nobody’s going to be refinancing there to get a better deal for the most part. Where do we see it
today? We’ve been in a downward trending interest rate environment for the last year and 33% of the
refinances were cash out refinances. The total cashed out like we mentioned, $325 billion back then,
$153 billion today in 2020, representing 7% of the tappable equity back then where today it’s only 2%.
So very, very different today versus back then.
What are people doing with that equity? Are they
accessing it, are they misusing equity like back in the housing crisis?
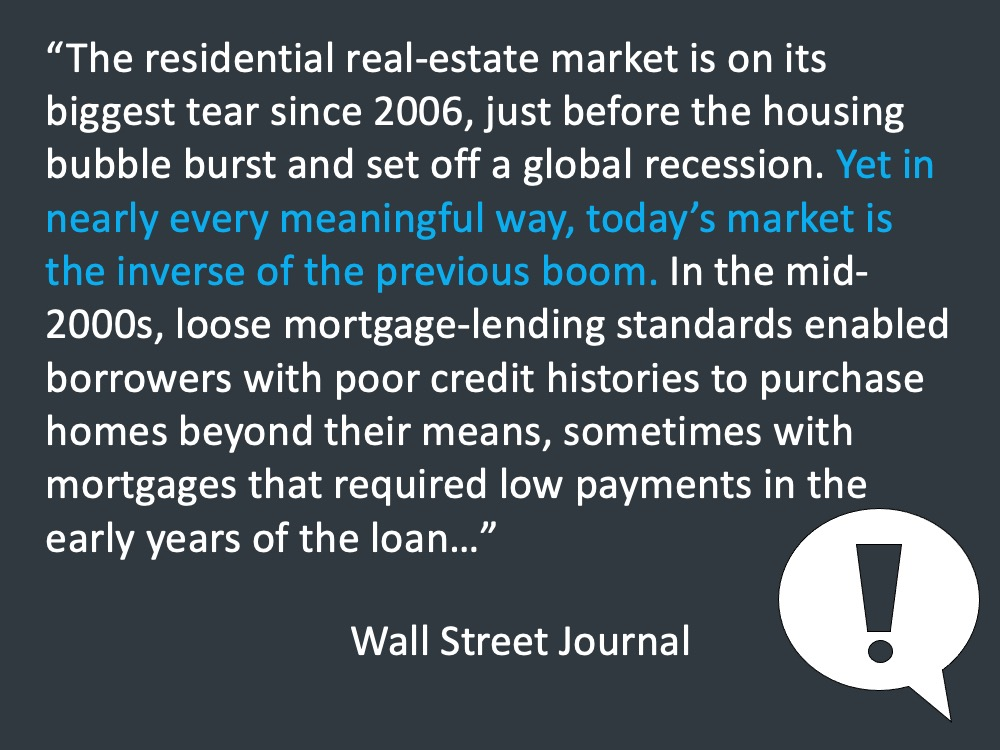
They go on to talk about how that froze up the credit markets across the country. And what do we know? We know that today lending standards have changed. We know that in order to go and obtain financing for a home loan you’ve got to qualify for financing of a home loan and you’ve got to demonstrate the ability to repay. It’s very, very different. No doubt the market that we’re in is showing tremendous demand for homes across the country.
NAR came out and said this, speaking of demand, “With demand for homes outpacing new listings, buyer competition continues to intensify. On average there were four offers per home sold (closed) February” according to NAR’s latest February realtor confidence index report, a monthly survey of realtors about their transactions. "One year ago, there were two to three buyers for every home sold. The intense competition has led to double digit price growth and properties selling in record time. To get back to a healthy supply equivalent of six months of monthly demand, an additional 2.7 million homes should be on the market for sale."
2006 vs. Now
So let’s break down the comparison of the two markets. Maybe the time leading up to 2006, the time to
today and give you a look at that so that you can educate your clients on the differences in the two
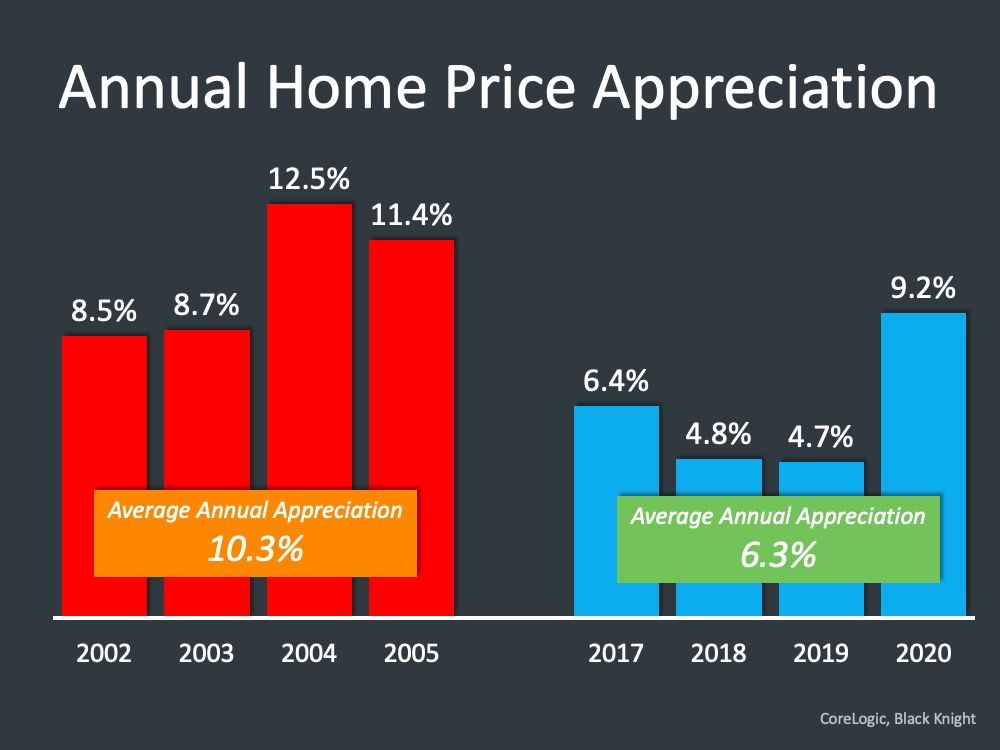
markets. First, if we look at annual home price appreciation, no doubt we’ve seen home price
appreciation be significant. In the last year, 2020 according to CoreLogic, 9.2% appreciation. But if we start to compare the years surrounding and the lead up to 2006, the lead up to today, back then the
average annual appreciation was over 10%. Just the average, from 2002 to 2005. And today, 2017 to
2019, the average, 6.3% in annual appreciation.
Big difference there. Certainly, we’re seeing
appreciation based on the lack of supply. The question is, people are out there and demand is strong. What does that mean for those that are
buying homes? This graphic here shows default risk in the mortgage markets. A very good visual to talk
about where are lending standards today as compared to back then. This yellow line, the reasonable lending standard there, a little bit of product risk, a lot of borrower
risk back then if you look at the graphic there around 2005 and 2006, where today, product risk has been
eliminated from our business.
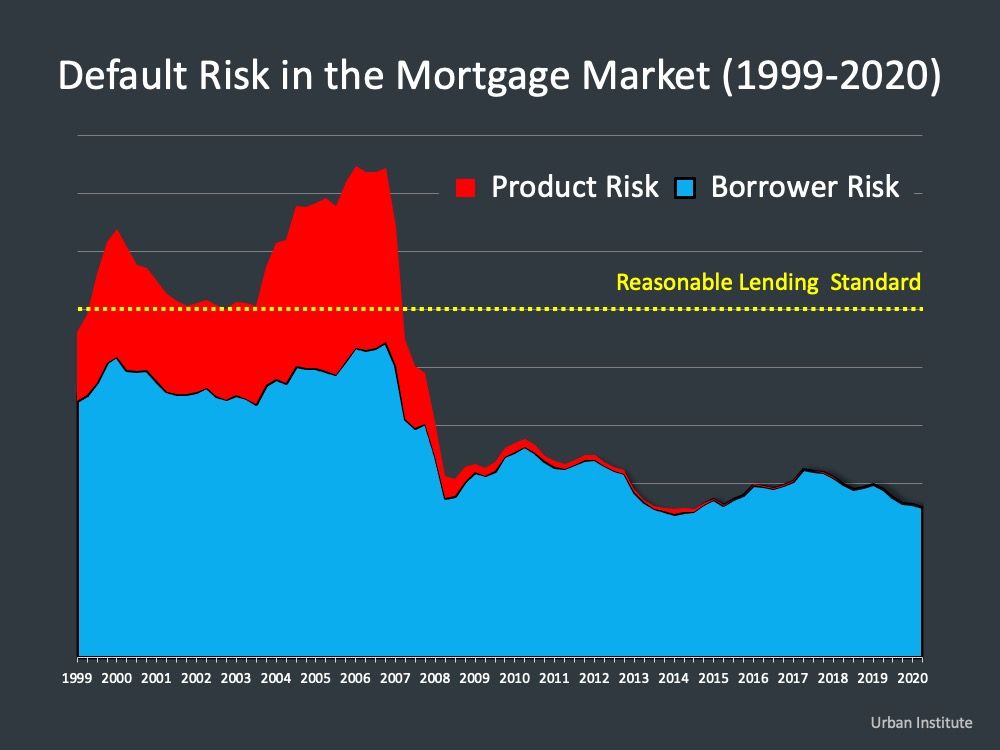
The loan products that were in the market back then aren’t around today. Borrower risk has been severely cut back as to where it was back then as well. It’s harder to quality for a home loan. When we look at demand we can say, back then demand was inflated, whereas today demand is real as measured by those in their ability to qualify for a home loan.
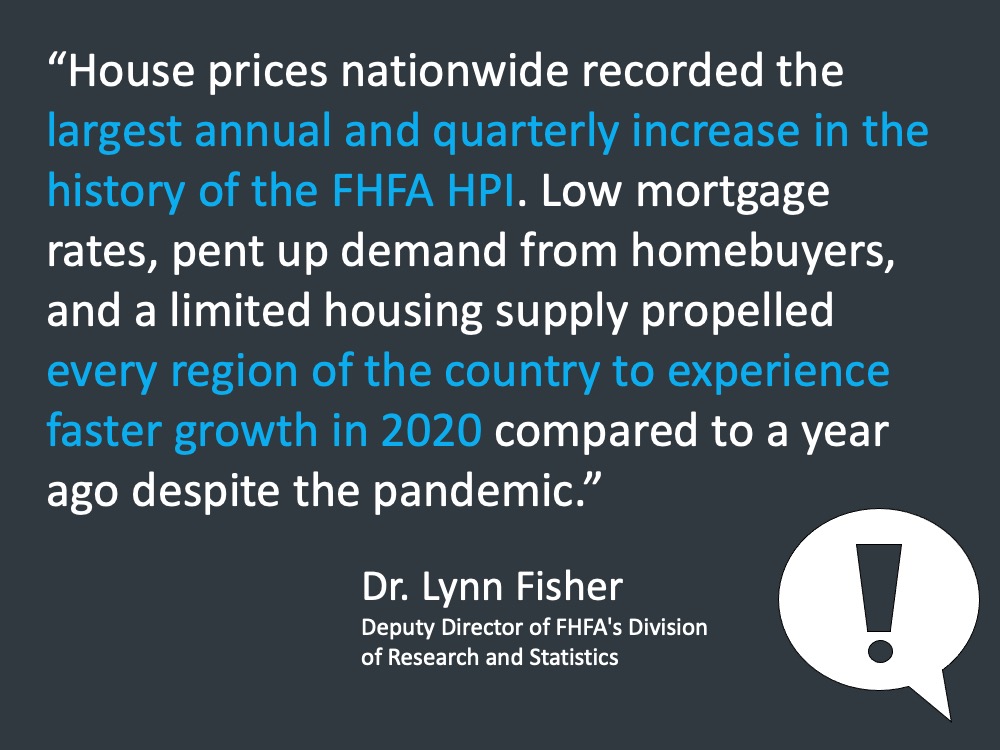
Back then another interesting comparison is single family inventory was rising in ‘04, ‘05, ‘06 and ‘07 and prices were going up, whereas today inventory has been going down and prices are going up. So when we look at economics, the amount of any item for sale as it goes down, there are less of it, it’s going to drive the price higher. So we’re dealing with dynamics in the market back then, as the number of homes in the market were rising and the price was also rising. Very much defined what we would say would be economic fundamentals in the real estate market, whereas today we can say, OK, the reason for the price growth, going back to Lynn Fisher’s comment, has been in large part by extreme demand for some very real reasons – low interest rates, the pandemic – and the lack of homes on the market and it starts to make sense there.
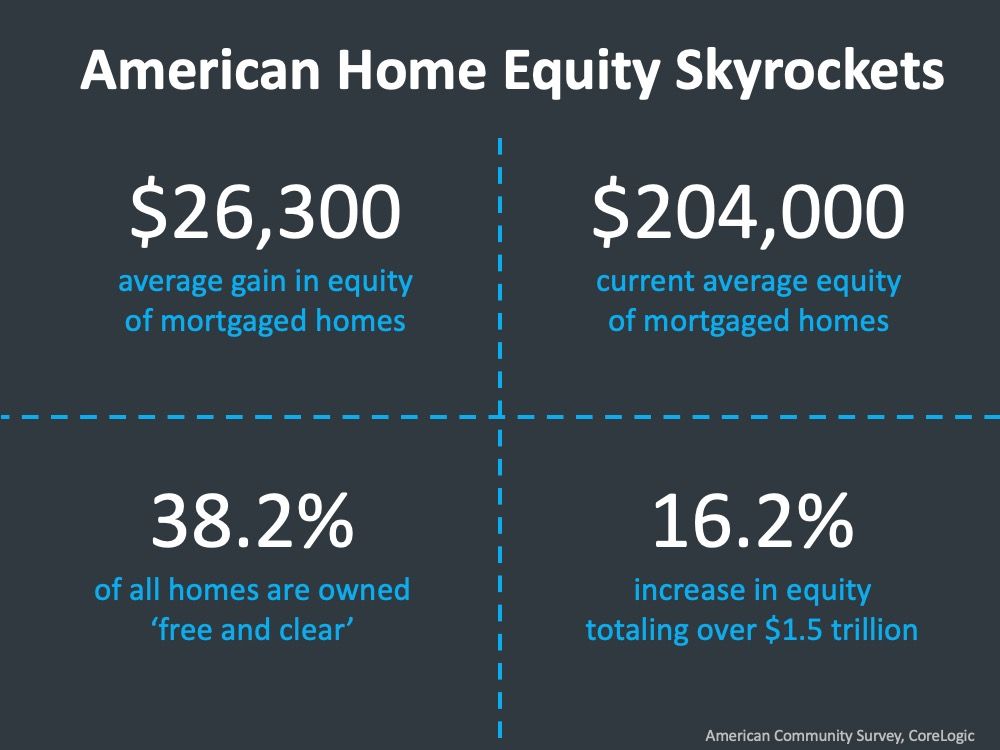
Odeta Kushi says this, she says, “It’s not just a seller’s market. It’s a super seller’s market.” This is an increasingly competitive home buying environment and that’s true across the country. As we look out across those that are in the market that are homeowners right now, what that means for them, as prices rise home equity across the country skyrocketed.
What are your Biggest Concerns in 2021?
LET'S TAKE A CLOSER LOOK AT HOW YOUR TOWN DID IN MARCH OF 2021 ⤵️
In the Town of Plymouth, home sales have increased through the month of March from 32 homes sold in February. The Average Days on Market remained relatively steady at less than one months time. The the Average Sale Price has remained under the $500k range but has increased from $476k in February. We are seeing less homes on the market in March but it is also difficult to gauge as homes are selling extremely fast.

In the Town of Hingham, the number of new homes entering the market has remained somewhat consistent month over month. Homes spent much less time on the market in March than they did in February. The Average Sale Price has remained in the million dollar bracket for the last 2 months. More homes sold in the month of March than they did in February bringing number of homes sold over what they were at in January.

In the Town of Scituate, the Average Sale Price increased from $694k in February. Home sales have remained consistent at 12 homes sold month over month however there is less overall inventory available on the market vs. February.

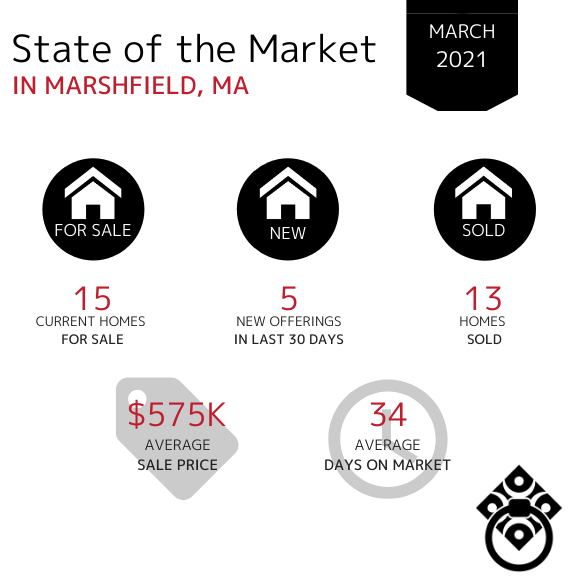
In the Town of Marshfield, the number of homes sold remained consistent from January through March. Properties spent slightly more time on the market during March than they did in February. The Average Sales Price decreased for the second month in a row, down from $755K in January and $592K in February.
In the Town of Kingston, the number of new offerings has increased slightly over the last three months. The number of homes sold has increased since just 5 homes sold in February. The Average Sale Price has continued to increase slightly, even higher into into the mid-$600K range while spending significantly less time on the market.

In the Town of Duxbury, the Average Sale Price of homes has increased once again into the million dollar bracket in March. Up from $987k in February. Available inventory has remained consistent along with the number of new offerings in the last 30 days. This tells us that Sellers are continuing to enter the market as we head further into Q2. The Average Days on Market decreased from 30 days in February to 16 daysh on market in March.

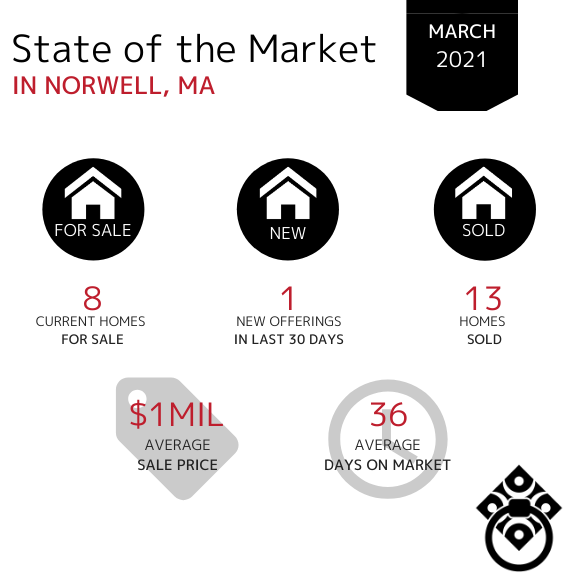
In the Town of Norwell, the Average Days on Market have increased from 9 days in February to over one month in March. There is limited inventory in many towns, including Norwell however, the number remains fairly consistent month over month with only slight fluctuations. The number of homes sold increased however which shows us that new homes entering the market were being purchased extremely fast which is consistent with most every South Shore and Upper Cape Cod town. The Average Sale Price increased from $878k in February.
In the Town of Cohasset, the amount of available inventory has remained consistent over the last six months which shows a steady market. The number of days on market has decreased once again to just over 30 days. The Average Sale Price increased from $1.8mil in February.

In the Town of Hanover, the number of homes sold increased slightly from 6 in February. The Average Days on Market decreased slightly and the Average Sale price has increased by $178,000.

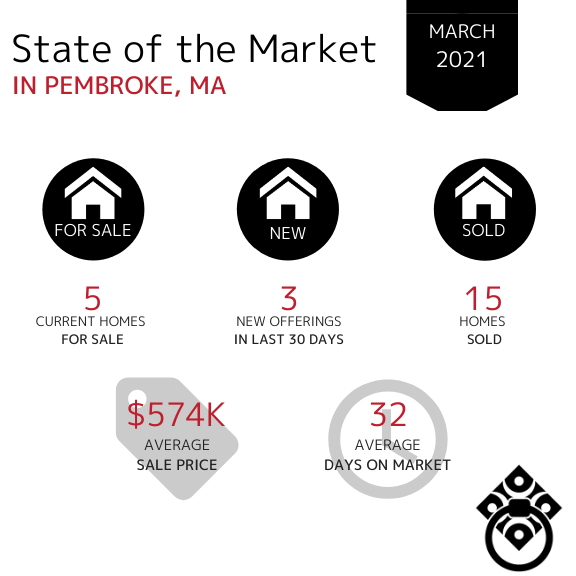
In the Town of Pembroke, the current amount of available inventory continues to be extremely low. There have been only 3 offerings within the last 30 days which could likely be attributed to the overall lack in available inventory. Sellers seem as though they are simply not ready to place their homes on the market in Pembroke. The Average Days on Market decreased since February, back down to about an average of 1 month on market. The Average Sale Price has decreased from $633K in February.
In the Town of Hull, the number of homes sold has increased increased from 5 homes sold in February. Homes entering the market have remained consistent and there is still a very limited amount of available inventory.
The Average Days on Market have dramatically decreased from 58 days in February. The Average Sale Price has increased from $499k in February to over $600k last month.

In the Town of Bourne, the amount of available inventory has leveled off and remains consistent month over month. The Average Days on Market has increased again from 13 days in February which shows us that while the buyer demand is strong, there are simply not enough homes available. The Average Sale Price has increased from the $507k and the amount of homes sold in March vs. February decreased slightly.

In the Town of Sandwich, the Average Days on Market decreased significantly while the number of homes sold remained fairly consistent with a slight increase from February. Available inventory increased from 14 available homes in February as well as a $160,000 increase in the Average Sale Price in March.

In the Town of Mashpee, the Average Sale Price decreased from $1.2M in February back to where it was at in January. The Average Days on Market have remained somewhat consistent with a slight increase over the last month. Similarly, the number of homes sold has remained consistent month over month.

In the Town of Falmouth, the Average Sale Price has increased once again from $635K in January and $814K in February. With limited inventory in most towns, there are still a good amount of new homes entering the market as we moved through the month of March resulting in an overall increase for the first time. The number of homes sold has also increased from 28 since January.

In the Town of Chatham, home sales increased from 19 homes sold in in February to 24 in MArch. The Average Sale Price has remained in the million dollar bracket over the last seven months. Homes have spent more time on market however there was a slight decrease since February.

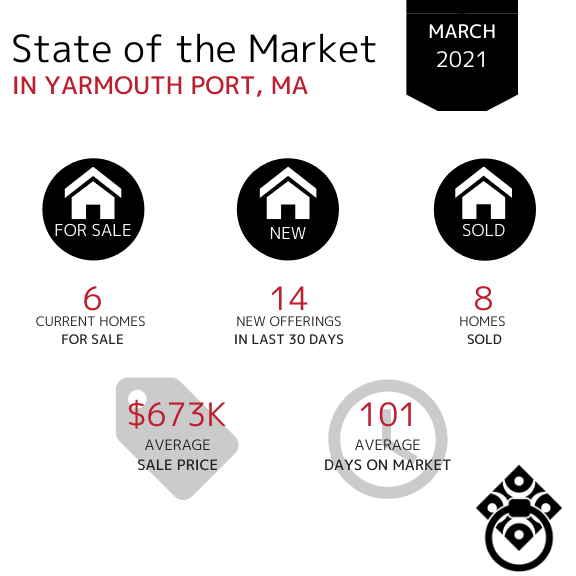
In the Town of Yarmouth Port, property sales have increased slightly since for the first time since February. The Average Days on Market increased significantly from 21 days in February however, more homes entered the market in the month of March - more the double.
If your town wasn't included in this report,
click here and let us know. We'll be happy to get you that data!
Learn How Much Equity Your Home Has Gained...
VIRTUAL SELLING
SEARCH FOR HOMES
*Market Information obtained from MLSpin, Cape and Islands MLS and Keeping Current Matters*


