


We have continued to crunch data from the South Shore and Cape Cod Association of Realtors® Multiple Listing Services (MLS) to help our clients and community better understand the state of the local real estate market as we ended 2020.
Last updated 1/12/21
This report is for single family homes in Plymouth County and Barnstable County. Please note Condos, Multi-family homes and land are excluded.
New Listings: New listings inventory continues to remain down by 66.5% from this time last year. In 2020 - 872 listings were available in Plymouth County as of 1/12/20 whereas there are only 292 homes on the market as of today. There was a decrease of 81% in the number of new listings in Barnstable County as compared to January 2020.
Price Changes: It is certainly still a Sellers market due to low amount of inventory. Sellers are still not in a market where they need to be negotiating and they're are getting more money for their homes than they would have at this time last year. Price change data is currently unavailable for Barnstable County.
Pending Contracts: As of January 12th, there are nearly the same amount of home sales pending as last year - 150 in 2020 and 152 in 2021. The average days on market has continued to decrease as demand remains high in the current market. Pending data is currently unavailable for Barnstable County.
Closed Sales: The market has continued to be extremely active since mid-May and that has not stopped as we enter into 2021. As January concludes we will have further data to compare year over year numbers for closed sales.
Mortgages: Mortgage rates have recently dropped again and remain lower than usual with a strong real estate market. Readily available mortgage types continue to be Conventional (Fannie Mae and Freddie Mac), Government (FHA and VA with tighter FICO score requirements), USDA, Mass Housing, Renovation and Jumbo (although some lenders don't have access to some of the bank investors that are doing them). First time home buyer rates are low right now and it's a great time to take advantage!
We are here to help: We are here for you to answer any questions and help you find solutions and possibilities during these uncertain, changing times. Please do not hesitate to contact us at [email protected] or call 508-746-0033.
2020 Real Estate Market Take Aways...
If we think about everything that happened in 2020, from the onset of the pandemic, to feelings of unrest, to various things happening across the country - in the real estate industry, market data was the difference maker.
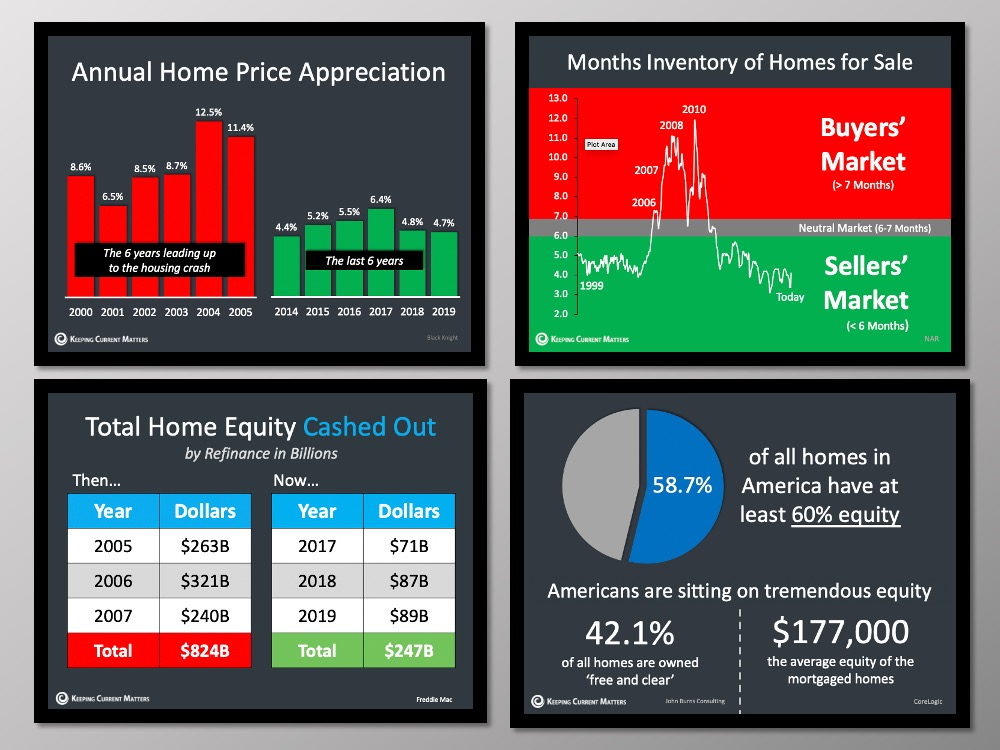
This slide is an overview of much of what we've covered throughout this past year. Talking
about all the reasons it wasn’t 2008 all over again, from appreciation to inventory to equity to all the things that we know about the real estate market that allowed us help you understand what was happening and why there was not a reason to fear the real estate market.
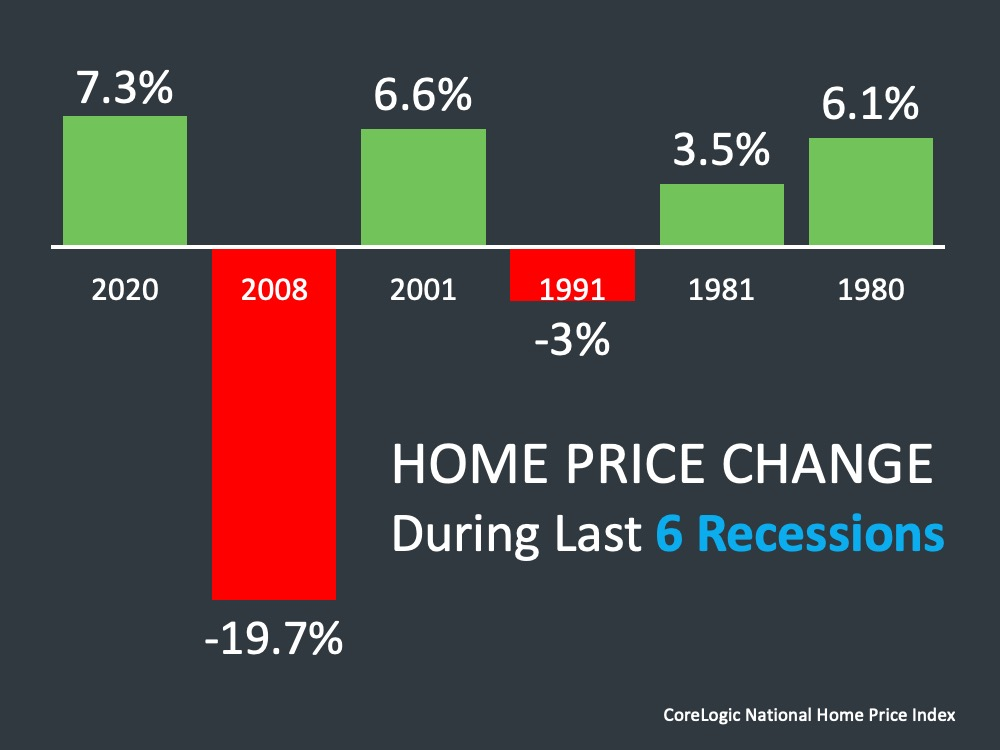
You might remember when we talked about home price change during the last five recessions, and how recession does not equal housing crisis. Everybody remembers the housing crisis of 2008, where homes lost almost 20% of value and yet, when we look at prior recessions, we see it’s just not the case. Now we have this year’s numbers that have come in from the CoreLogic National Home Price Index, showing home prices rose 7.3% according to CoreLogic in 2020. As you can see, 4 out of these 6 recessions home prices actually appreciated.
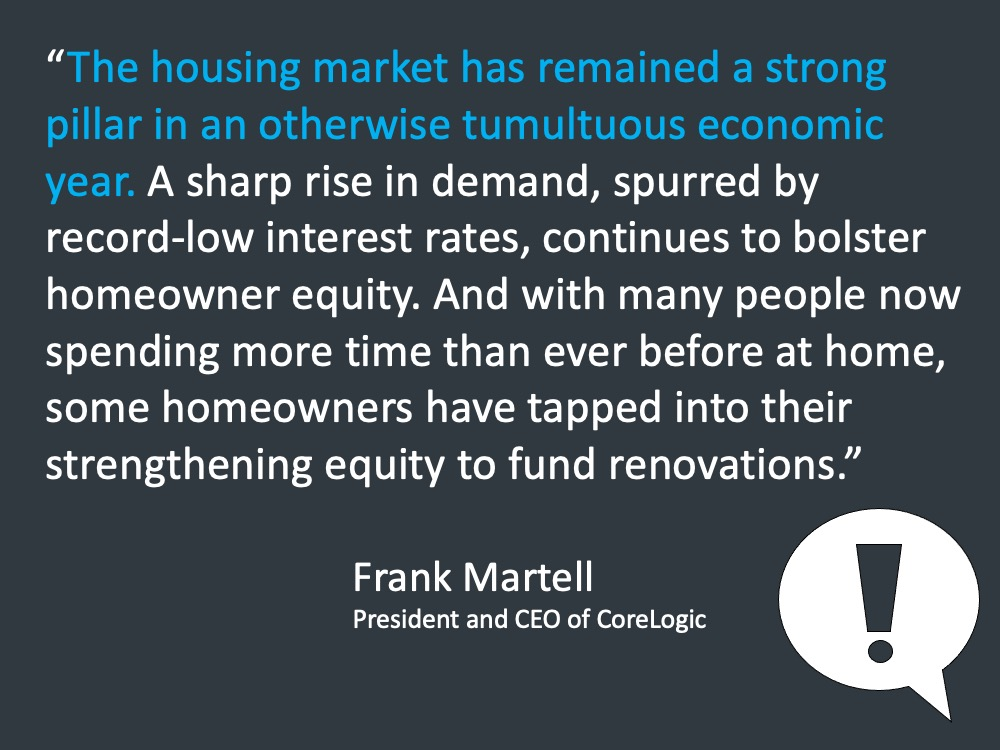
The truth of this story right now as we kick off 2021 and all the things that happened in 2020
is that appreciation of 7.3% has grown home equity. Through the past year, home equity has been critical to people across the country in a lot of
different ways, in ways that they’ve used it maybe to weather the financial storm, to have the ability to
go out and sell their home if they needed to and not be underwater and literally have to go into
foreclosure.
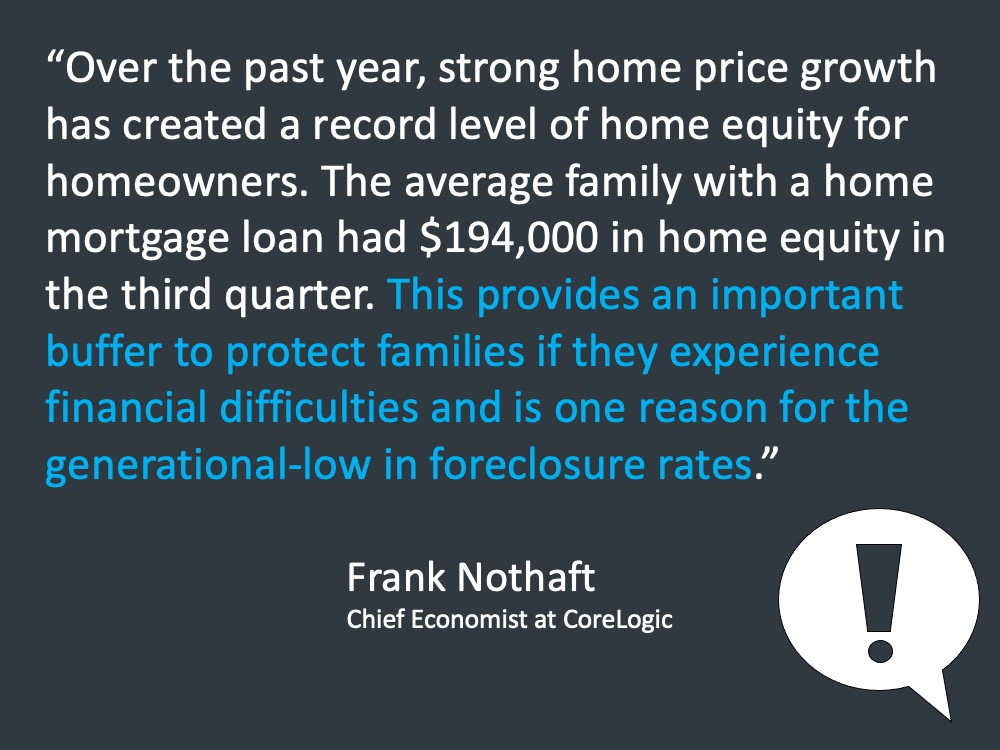
Equity was the star or real estate in 2020, to say the least. In regards to the accompanying slide, another reason for the generational low in foreclosure rates is there’s a moratorium right now on foreclosures. But, this growing equity has and will continue to help people weather the storm relative to things they may be experiencing as a fallout of the pandemic and the challenges that’s caused in businesses and the economy across the country.
If we go deeper into this, from CoreLogic, $17,000 is the average gain in equity on a mortgaged home. We just talked about $194,000 being the average of a home with a mortgage on it. CoreLogic says 38.2% of the homes are owned free and clear in this country and 10.8% is the increase in equity, totally over a trillion dollars since the third quarter.
Looking Forward...
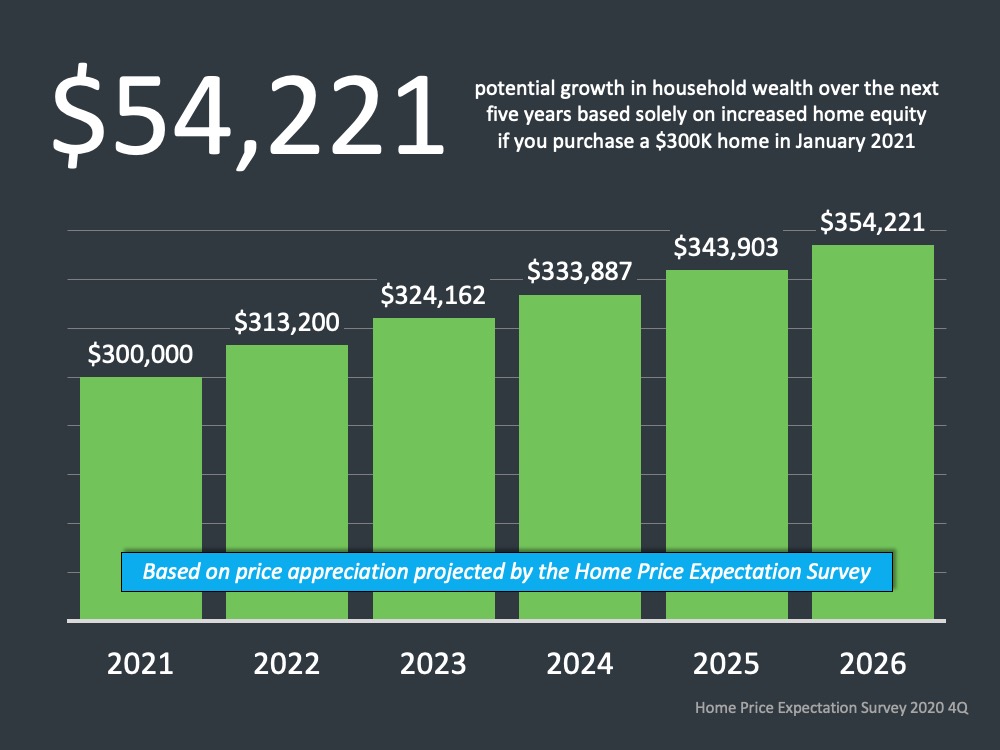
The most recent home price expectation survey
shows us that over the next five years, the average $300,000 home, if purchased today, that
homeowner stands to gain in appreciation about $50,000. $54,221 in appreciation, adding to that equity.
That equity provides opportunities to people, whether it be to start a business, to send a child
to school, etc. The idea
of home equity is something that as we look back, and we look forward, is certainly the benefit of home
ownership today.
These financial benefits have gotten stronger through the pandemic for
homeowners across the country.
What’s ahead in 2021? A lot of that’s going to be dependent upon the course of the coronavirus vaccinations and all of those things that are going to contribute to the path forward. We can help make the path clearer relative to real estate through looking at what experts are saying about 2021.
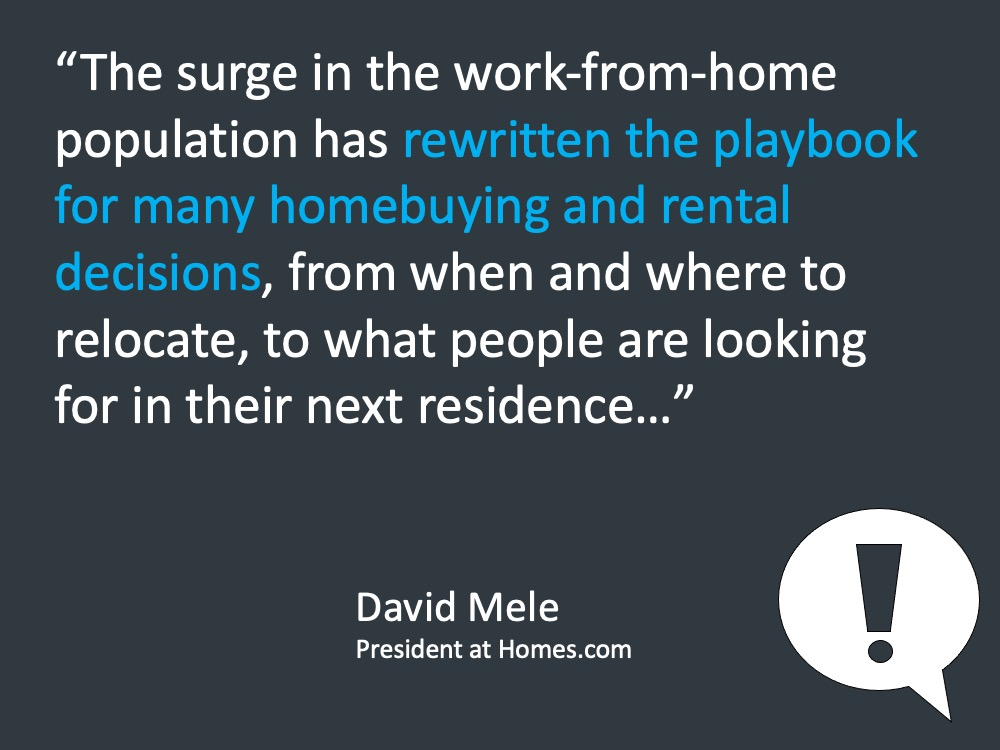
Folks that are working from home and folks that may not have to be in the office 5 days a week, has
driven homebuying decisions however this surge in working from home is really changing the way people make decisions about
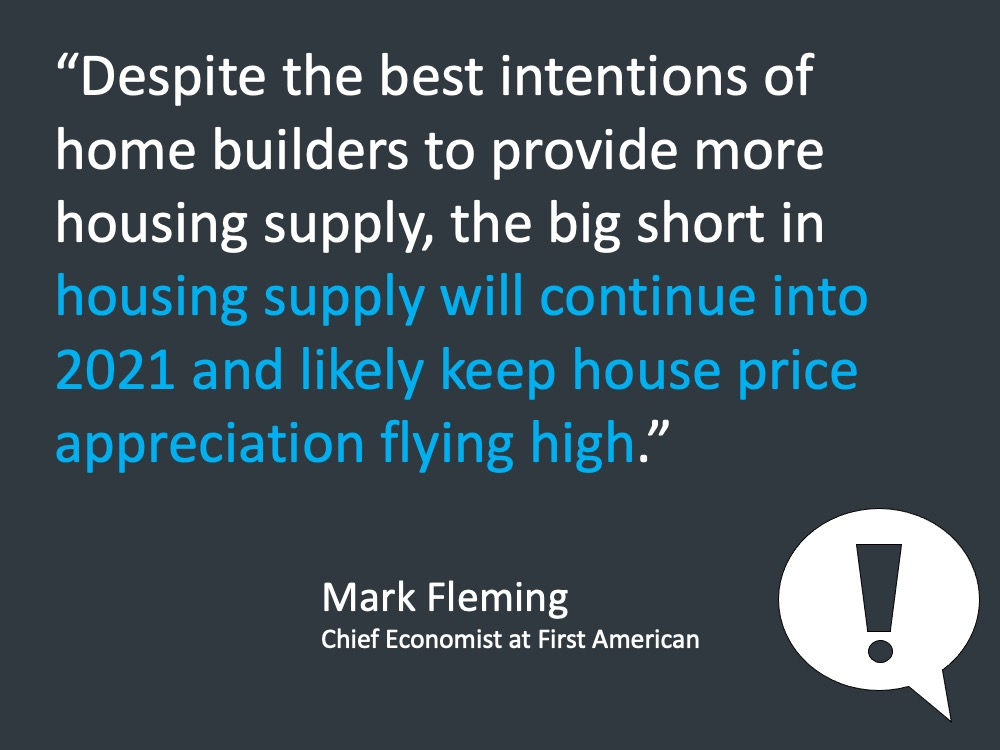
where they live. It's likely we can expect in 2021 for more of that to become clearer for people and when it becomes clearer, they can then make that decision of where they want to buy a home. Although, the challenge still remains in the low amount of inventory and that will continue through the first half of the year and keep that upward pressure on home prices across the country.
.png)
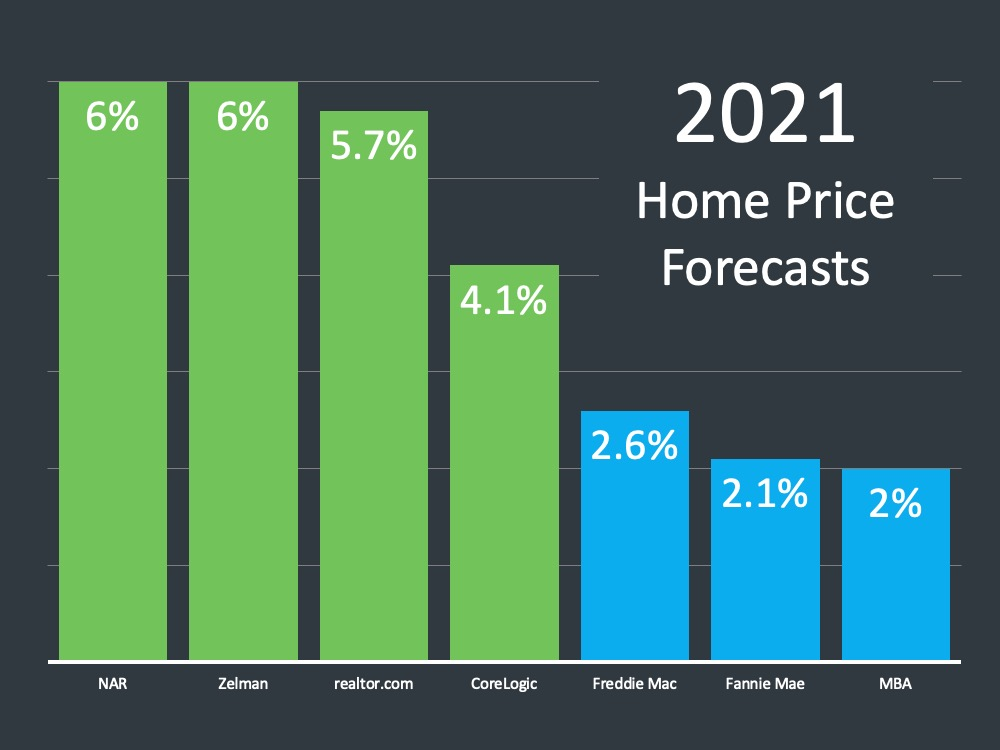
Here is the 2021 Home Price Forecast, we can see here, anywhere from 2-6% from NAR to
MBA and everything in between, if we take out the two on the end, we see probably between 3 and 4%
home price appreciation.
Now what does this mean? This is giving a sign to more inventory coming in the market, whether that comes from builders, people
putting their homes on the market that didn’t last year, or even those
affected by the pandemic that may need to sell their home. No matter the circumstance, more inventory will be coming back to the
market and in turn helping to keep in check home price appreciation.
.png)
“The bright spot for buyers is that more homes are likely to become available in the last six months of 2021. That should give folks more options to choose from and to take away some of their urgency. With a larger selection, buyers may not be forced to make a decision in mere hours and will have more time to make up their minds.” - Realtor.com
So, as we go throughout the year, expect more inventory to go on the market in the second half of the year as opposed to the first half of the year. Why is that? Because there are expectations from again, builders having homes available to go out and sell. Also, the pandemic to be further along in recovery efforts as well as people feeling safer to go out and list their homes for sale, and things that contributed to people not doing that in 2020.
Now a lot of the above is going to depend ultimately on economic
recovery, which is a question on a lot of people's minds.
It’s just a few months
ago where we were talking about the comparison to the Great Recession and even the Great Depression,
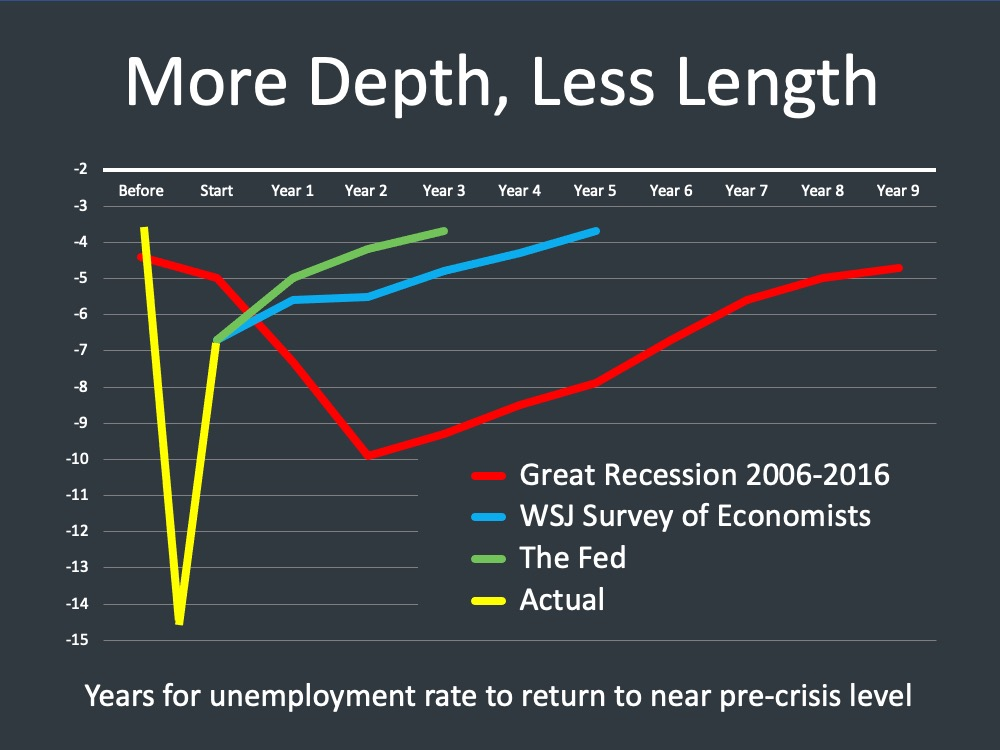
relative to unemployment. If you remember, we talked about the more depth, less length slide.
In yellow, that’s the actual unemployment drop there and we know we hit
almost 15% unemployment in this country, but for a very, very short time. Then we see that V recovery in unemployment.
According to Wall
Street Journal and the Fed, we show both of those right here in blue and in green, somewhere between
three and five years to get back to where we started in this country before that pandemic and
unemployment. You can see those actual projections right here, going into 2021, 2022 and 2023, where
we’ll be. And you see this slight decrease in unemployment as time goes on.
Where we
stand today, 6.7% unemployment in this country is not a good thing however it is certainly not at
the high of 15% like we experienced towards the middle of last year.
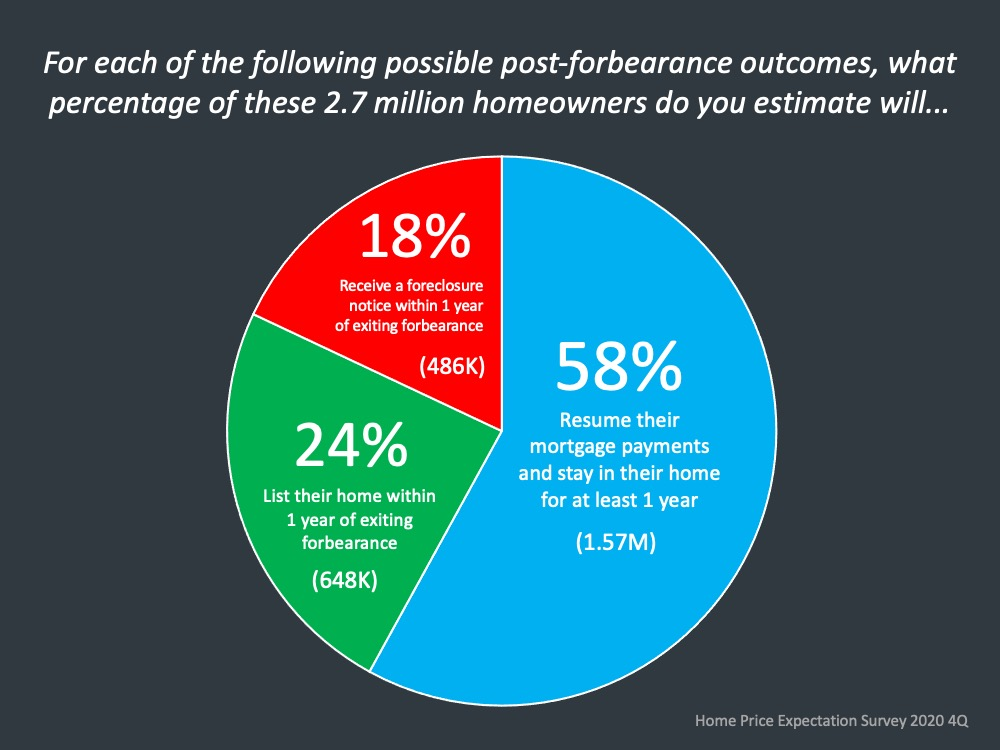
The other big question that’s going to continue to be around is what’s happening with
forbearance. The overwhelming majority will continue on, and will be in their homes and will be largely
unaffected. 24% there in green will list their home within one year of exiting forbearance. That’s 648,000 individuals and families in that bucket. 18% will receive a foreclosure within one year of
exiting forbearance, which is 486,000.
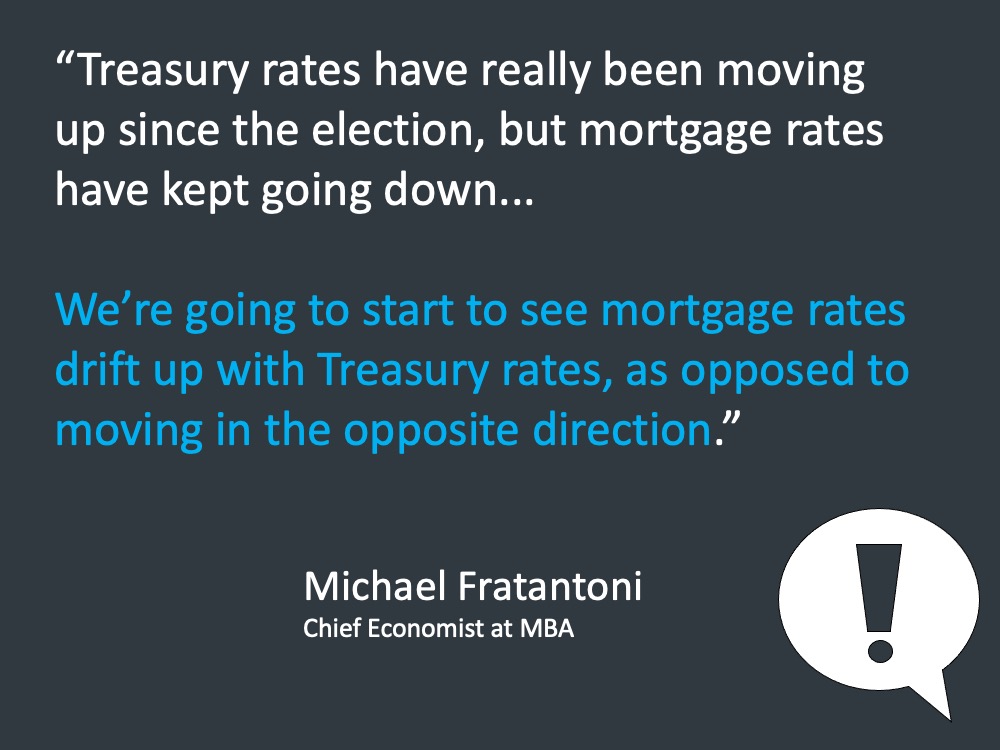
the other thing is the reality of where we stand today, which is that Treasury rates have been
moving up since the election, according to the MBA however, mortgage rates have kept going down. That’s because the Federal government is pinning down mortgage rates by all the action they’re taking in
the secondary bond market.
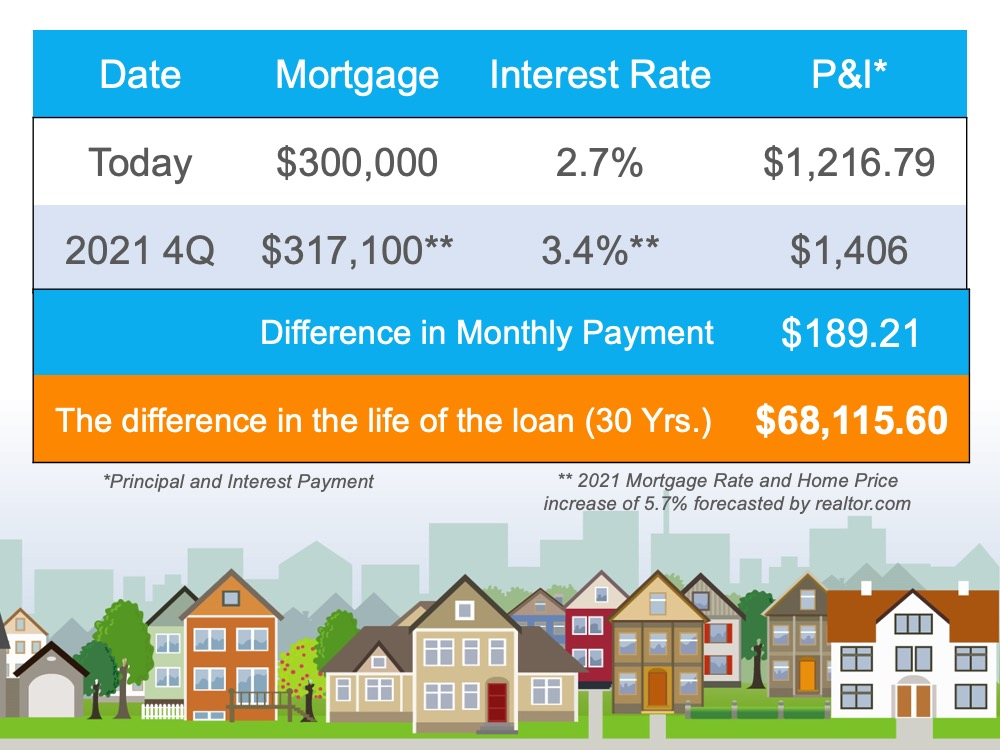
The outlook as the economy
improves is that rates will rise. As we look into this year, and we look into 2022,
we have to ask -what is going to happen there? We’re calling for home price appreciation. Experts are saying mortgage rates are going to rise. Certainly, we think from
what we see from experts is that we will be in a good mortgage environment but they’re going to rise. With that, the KCM team made a calculation based upon where interest rates are today, and
where with appreciation and interest rates a year from now, where could we potentially be.
Most experts would say, what’s driven homeownership in 2020? Well, needs have changed as well as the low rates. But as we look forward, those aren’t going to hang around forever.
Are you Ready to Sell Your Home?
LET'S TAKE A CLOSER LOOK AT HOW YOUR TOWN DID IN THE MONTH OF DECEMBER ⤵️
In the Town of Plymouth, home sales increased from 74 sales in November as we closed out 2020. The Average Days on Market increased slightly while the the Average Sale Price has increased from $496k in November.

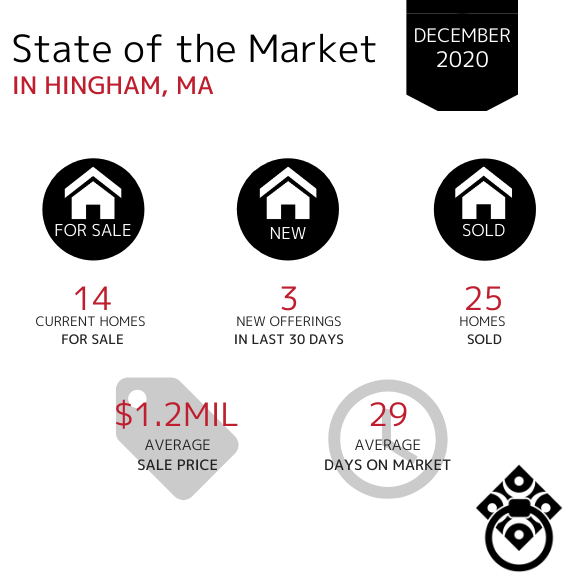
In the Town of Hingham, the number of new homes entering the market has continued to decrease month over month. Homes spent less time on the market during the last month of the year. The Average Sale Price has remained in the million dollar bracket for the last 3 months.
In the Town of Scituate, the Average Sale Price has decreased from the mid-$800,000s from November. Home sales increased in the last month of 2020 however there was less overall inventory available.

In the Town of Marshfield, the number of homes sold remained consistent month over month. Properties are continuing to spending just about a month on the market. The Average Sales Price has increased from $591K in November.

In the Town of Kingston, the number of new offerings is nearly non-existent as we ended 2020. The number of homes sold increased from 16 in November. The Average Sale Prices have remained consistent in the mid-$500K range.

In the Town of Duxbury, the Average Sale Price of homes has drastically increased since November but still remains below the million dollar bracket. Available inventory has decreased and there were no new offerings in the last 30 days. The Average Days on Market decreased by half (40 in November).

In the Town of Norwell, the Average Days on Market have decreased in the month of December from 67 days in November. There has been a decline in available inventory and there was no new inventory that was listed within the last 30 days. The number of homes sold remain consistent and the Average Sale Price increased into the million dollar bracket.

In the Town of Cohasset, the amount of available inventory has remained consistent over the last three months which shows a steady market. The number of days on market has decreased significantly from 67 in November. The Average Sale Price remains in the million dollar bracket month over month, slightly lower than November.

In the Town of Hanover, the number of homes sold decreased by 50% in the month of December. The Average Days on Market has increased and the Average Sale price has decreased by $49,000.

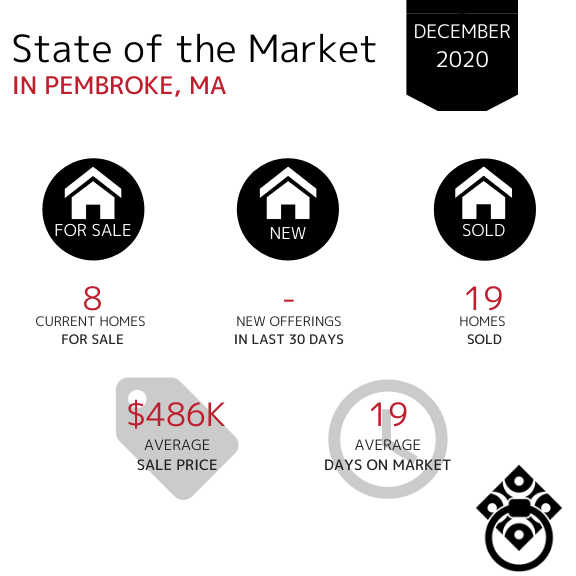
In the Town of Pembroke, the current amount of available inventory is very slim. Down from 14 homes available in November. There have been no new offerings within the last 30 days which could likely be attributed to the holidays. The Average Days on Market continued to decrease from 30 days in November. The Average Sale Price has also decreased from the $515,000 in November.
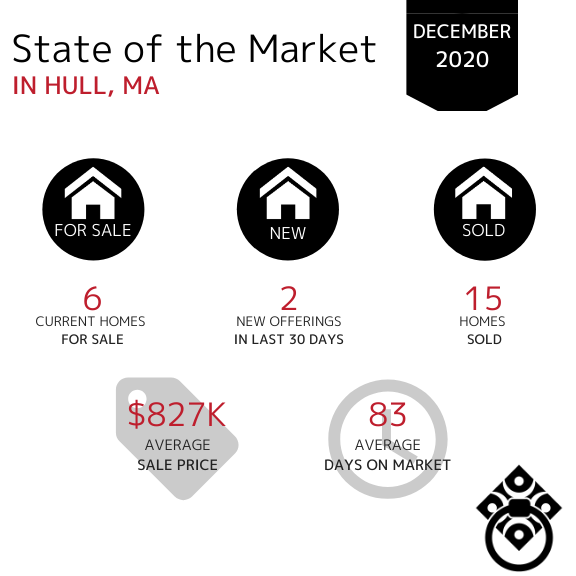
In the Town of Hull, the number of homes sold remained consistent from November through December. Homes entering the market have slowed down and there is significantly less inventory available.
The Average Days on Market have remained around 80-90 days and the Average Sale Price has increased by $228K.
In the Town of Bourne, the amount of available inventory has continued to decrease month over month as the holiday season approached. The Average Days on Market has remained consistent since October which tells us that the buyer demand is there however the lack of inventory is hindering them buying at an even faster pace. The Average Sale Price has increased since November which is a great sign for home values as the same amount of homes have sold month over month.

In the Town of Sandwich, the Average Days on Market increased while the number of homes sold in December remained consistent with November numbers. Inventory remains fairly consistent which shows us that Sellers are actively placing their homes on the market and buyers are ready to make their move.

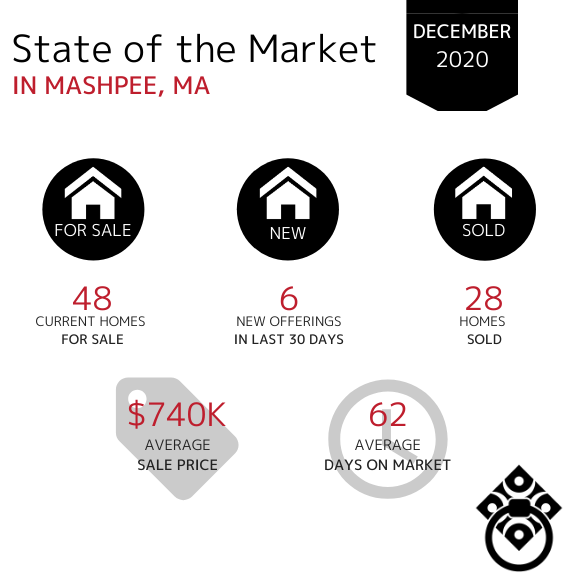
In the Town of Mashpee, the Average Sale Price has decreased out of the million dollar bracket, back to lower average prices than we saw in October at $801,000. The Average Days on Market have decreased again from 89 in October. The number of homes sold has remained fairly consistent since July with just a slight decrease from November to December.
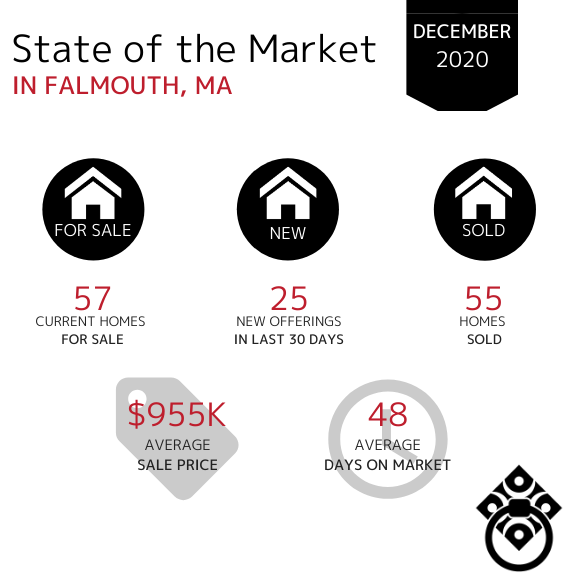
In the Town of Falmouth, the Average Sale Price has increase from the mid $700,000s in November. There are still plenty of new homes entering the market as December pressed on, more than most other towns were able to say. The number of homes sold has decreased although not drastically month over month.
In the Town of Chatham, home sales continued to slightly increase since October. The market in Chatham is remaining consistent with throughout the last three months. The Average Sale Price has remained in the million dollar bracket over the last 4 months with a slight increase from $1.1M in November. Homes are also spending less time on the market.

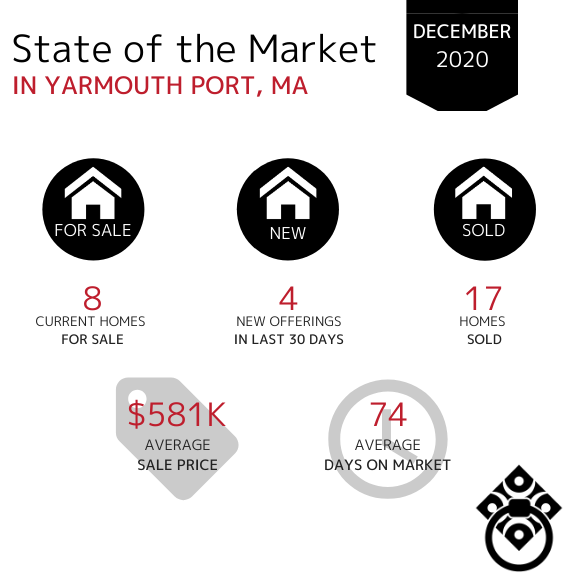
In the Town of Yarmouth Port, property sales have increased from 7 sales in November to 17 in December. The Average Days on Market increased as well however more homebuyers secured housing in the village of Yarmouth Port than in the past few months!
If your town wasn't included in this report,
click here and let us know. We'll be happy to get you that data!
VIRTUAL SELLING
SEARCH FOR HOMES
*Market Information obtained from MLSpin, Cape and Islands MLS and Keeping Current Matters*


