We have continued to crunch data from the South Shore and Cape Cod Association of Realtors® Multiple Listing Services (MLS) to help our clients and community better understand the impact of COVID-19 on our local market as we enter into the Phase 3 of re-opening.
Last updated 7/7/20
This report is for single family homes in Plymouth County and Barnstable County. Please note Condos, Multi-family homes and land are excluded.
New Listings: New listings inventory has continued to decrease year over year. Down 46.22% from this time last year. In 2019 - 1,480 listings were available in Plymouth County as of 7/7/19 whereas there are only 796 homes on the market as of today. There was a slight increase of 0.8% in the number of new listings in Barnstable County.
Price Changes: Sellers are still not negotiating in the current market. 44.19% less Seller's have adjusted their asking prices this year versus 2019. Price change data is currently unavailable for Barnstable County.
Pending Contracts: As of July 7th, there has continued to be a decrease in the number of pending sales of 8.62% from what the numbers were in 2019. However, average days on market remain steady year over year. Pending data is currently unavailable for Barnstable County.
Closed Sales: A strong start of 2020 has helped sold data remain rather unscathed throughout the hardest months of the pandemic and although the market is on fire right now, there has been a further decrease by 354 homes year over year in Plymouth County. In Barnstable County, a decrease of 1.9% less sales year over year as of July 7th shows that the market on the Upper Care was fairly similar to the market in 2019 at this time.
Mortgages: Mortgage rates continue to remain consistent over the last month and continues to do so as we enter into July with a strong real estate market. Readily available mortgage types continue to be Conventional (Fannie Mae and Freddie Mac), Government (FHA and VA with tighter FICO score requirements), USDA, Mass Housing, Renovation and Jumbo (although some lenders don't have access to some of the bank investors that are doing them).
We are here to help: We are here for you to answer any questions and help you find solutions and possibilities during these uncertain, changing times. Please do not hesitate to contact us at [email protected] or call 508-746-0033.
What is happening with the Housing Market?
We have our first look at projected home price appreciation and what you can see is, six leading experts that project appreciation. This year, you can see five of the six experts are calling for appreciation this year. Three of
those five are calling for appreciation over 3%.
As we go into 2021, we can see that
all six are forecasting appreciation. And even some going into 2022 forecasting appreciation.

Appreciation is being driven by the lack of supply across the
country. Across the country right now, we have a little more than four months of inventory on
the market and available homes for the number of people that want to buy them, literally an undersupply
of homes on the market. That’s is going to vary, depending on where you’re at in the price
point in that market, or in your market. But suffice it to say that upward pressure is being applied to
prices today, which is driving us forward. This is the initial look
at what experts are saying around pricing and what we can expect going throughout this year and into
next
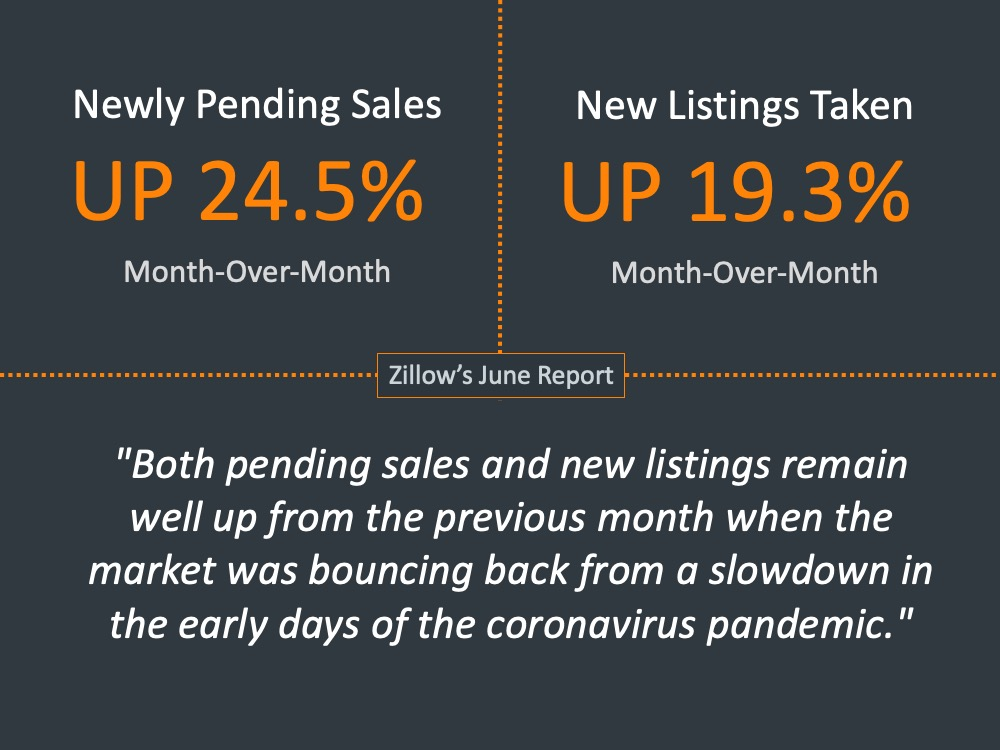
We know from Zillow's June report, that month over month, newly pending sales are up 24.5 percent
and new listings taken are up 19.3 percent. We’re not where we would be normally this time of year,
but month over month, we’re seeing improvement. We're seeing improvement there, but still need more distance to cover, especially in listings across the country.
When is the economy going to recover?
Housing will fare better as businesses start to open up, as the economy starts to gain steam
again and experts are projecting that recovery. You know, housing
will lead that recovery. And housing will drive the US economy forward as we go into the second
half of 2020.

What is happening with Employment?
Bureau of Labor Statistics on Friday released their June report, which
covers up until the middle of May, from the middle of April to the middle of May. The
biggest shock on that report was the gains. There was actually a gain in number of jobs while most people had
projected the other way. What we could see in most of the categories, there were actually job gains
equally up to 2.5 million. As mentioned in previous month's reports, we believe very strongly that
the food service in bars to bartenders and to service in restaurants, once they started opening the
restaurants up, they were to come back. Even with the social distancing, a lot of local governments are
making sure that they are trying to help restaurants as much as possible. In some cases, closing streets
and allowing tables out in the street for people to sit in, in order to drive that business.
What we’ve seen is 1.4 million of those people have already come back to work.
As we told you, construction, education, health services, the doctors’ offices are opening back up again. So the education and health services are opening. One thing that we didn’t get right was the fact that we thought people were going to be very, very hesitant to go out and shop. So, we didn’t realize the retail jobs would (ph) come back as strong as they did. But it seems that after being pent up in your house for 90 days, the American people decided, you know what, let’s go shopping. And we’re seeing unbelievable numbers being reported. Even early this morning, Macy’s reported that their numbers that they have right now, the amounts of sales they’re making on a daily basis, is blowing away their projections.
So what we’re seeing is the economy is coming back. And when the economy is coming back, the job market is coming back.
If we go over to the red bars, we see all others. Many of those jobs are in the mining industry. The pandemic didn’t really impact that. They were losing jobs for years already. The hotel industry is still struggling to come back. There’s no question about that.
CNBC said this, “The May gain was by far the biggest one-month job surge in US history since at least 1939." which is a pretty big statement.

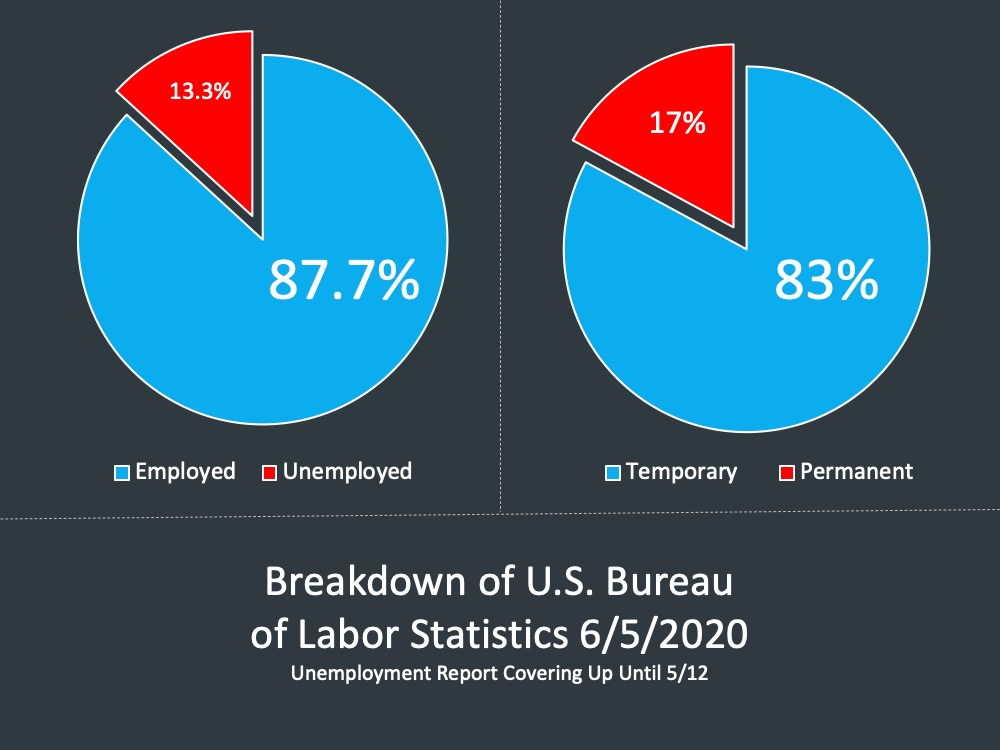
If we take a look at the unemployment, temporary versus the unemployment rate first, and then temporary versus permanent, the employment rate—and David’s going to touch on this in a second—that was reported was 13.3 percent.
That means that 87.7 percent of the people still have a job.
Of those people that are unemployed, 17 percent think it’s permanent. 73 percent think that as the economy opens up, they’re going to go right back to the same jobs they had.
That number changed a little bit from the last report. If you remember, it was only 10 percent of the people thought they were permanent. We told you we thought that was a little bit optimistic and it turned out to be the case. Now that 73 percent that think it’s temporary, it aligns with the second report that came out.
A report from the Federal Reserve Bank said that 75 percent of the job losses are temporary layoffs and furloughs according to the employers. So, the employees think, 73 percent of the employees think it’s temporary. And the employers think that, of the people they laid off, 75 percent are coming back, three out of four are coming back.
We also have to realize that different companies are actually hiring. That same Federal Reserve Bank report
said there are news reports of large scale hiring at firms like Amazon, Walmart, CVS Healthcare,
Domino’s Pizza, and other companies that show increase demands in reaction to the pandemic and
slowdown. Amazon, which was about 175,000 people they hired,
drivers, warehouse workers, management staff to handle that, they’ve already said that about 150 of the
175,000 are going to be permanent positions, not temporary positions. So, the job market is
looking much, much better.
What is happening with real estate inventory?
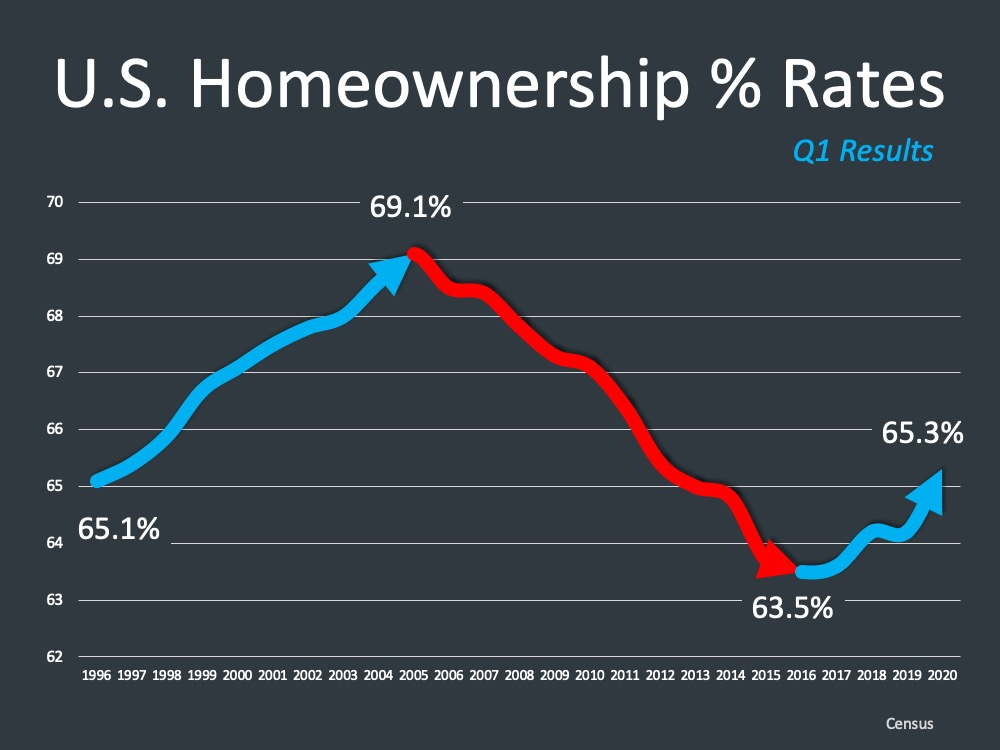
The census came out
with the first quarter results this year showing that the US homeownership rate continues to grow. We know that homeownership was growing up until the housing crash and
then we saw the decrease, as you can see there on the red line, and then this increase for the last four
years of homeownership growing.
The survey from Concentrix Analytics here talks about the non-financial benefits of
homeownership, which I would argue that we need to remind people of that. In this study, you know,
when I see it, it makes me happy to know that 93 percent said owning a home made them happier. 88
percent of people studied here said buying a home was the best decision they’ve ever made. And 79
percent said, you know, owning a home has changed them for the better
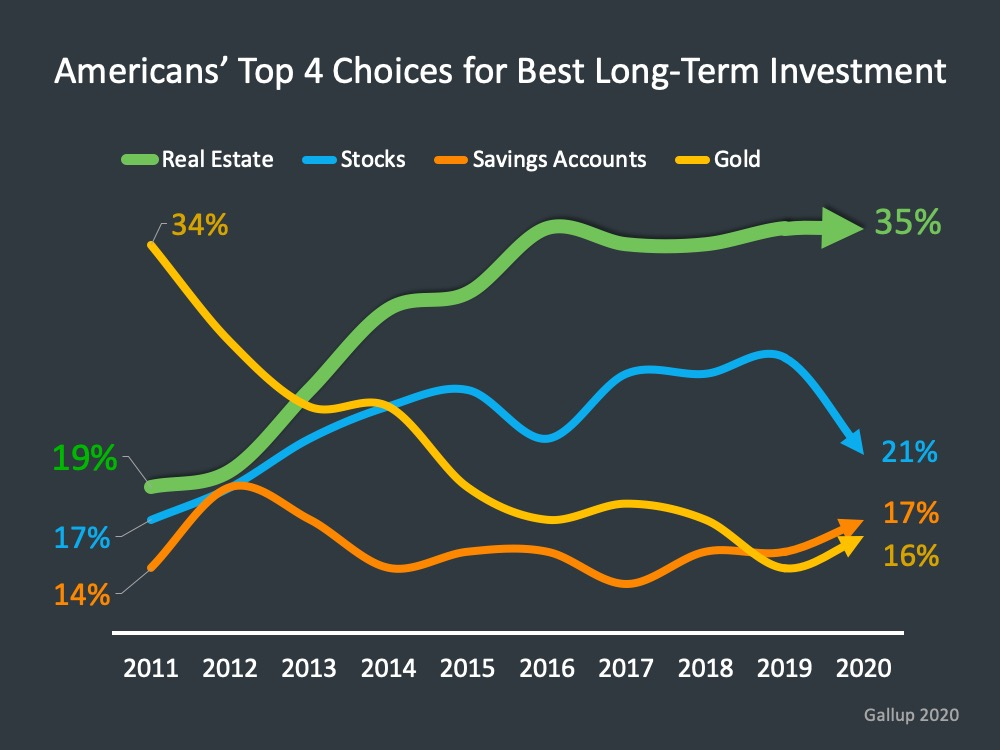
Gallup released their survey of best long-term investments and they say here, Real
estate at 35 percent, remains the most favorite investment to Americans, as has been the case since 2013,
when the housing market was on the rebound. More than a third of Americans have named real estate as
the top investment since 2016.
As far as
investments, we also know that the housing market remains a strong choice for long-term investment.
LET'S TAKE A CLOSER LOOK AT HOW YOUR TOWN DID IN THE MONTH OF JUNE ⤵️
In the Town of Plymouth, home sales increased throughout the month of June. The number of Average Days on Market has remained consistent from May through June.
Homes continue entering the market however the number of new offerings within the last 30 days has decreased.

In the Town of Hingham, the number of new homes entering the market has remained steady showing us that Sellers are continuing to place their homes on the market as homes are selling at a consistent pace. The Average Sale Price has increased from $826 in May back to $1.1M in June.

In the Town of Scituate, the Average Sale Price decreased slightly during June. Home sales picked up in June and were selling much faster at less than 2 months time. The number of homes SOLD also increased while the number of new offerings remained consistent. This tells us that with the start of the summer months, the beachside town of Scituate is continuing to be a more active market for both Buyers and Sellers.

In the Town of Marshfield, the number of homes sold during the month of June remained consistent along with the number of new homes entering the market. This tells us that Sellers are continuing to list their homes on the market and Buyers continue to have a bit of variety. Properties are selling at a slightly faster pace - just under 2 months.

In the Town of Kingston, there was a decrease in the number of new homes for sale. The number of homes sold increased showing that buyers are ready to secure housing. The Average Days on Market increased from 30 in May to 56 in June. The Average Sale price increased by nearly $100,000.

In the Town of Duxbury, the Average Sale Price of homes decreased from the million dollar bracket to $799k. Available Inventory has decreased slightly along while the Average Days on Market increased from 57 in May. This indicates that homes on the market are not valued as high and they are staying on the market longer.

In the Town of Norwell, the average days on market remained consistent month over month. There has been a consist amount of inventory from April through May and into June. The Average Sale Price has increased significantly from $701K in May.

In the Town of Cohasset, the amount of available inventory has slightly decreased as we entered into the beginning of the summer months. The number of days on market has increased since May. Average Sale Price has increased into the million dollar bracket at $1.1M.

In the Town of Hanover, the number of homes sold have decreased slightly in June. The Average Days on Market significantly increased from 31 in May to 64 in June which indicates a slowing market as we entered into the beginning of summer in Hanover.

In the Town of Pembroke, the amount of new offerings in the last 30 days have increased however the total amount of homes for sale has decreased slightly. The Average Days on Market significantly decreased from just over 3 months to just about 1 month in June. The Average Sale Price has remained consistent in the mid-high $400,000s over the last four months.

In the Town of Hull, the number of homes sold has decreased from 9 in May to 4 in June. There is a lack of inventory giving buyers little to choose from at this time which leads to why homes are staying on the market for much longer than they were in May. The Average Sale Price has increased from $497K in May to $563K.

In the Town of Bourne, the amount of available inventory has decreased slightly in June. The Average Days on Market significantly increased from 58 in May to 74 in June. Once again, this tells us that the buyer demand is there however the lack of inventory is hindering them buying at an even faster pace. The Average Sale Price has remained in the mid-$400k range.

In the Town of Sandwich, the Average Days on Market have continued to decrease as we closed out the month of June down from 92 days in May. The number of homes sold has remained steady through the month of June and the amount of new inventory in the last 30 days has remained consistent as well!

In the Town of Mashpee, the Average Sale Price has remained relatively consistent month over month in the high $500,000s. The Average Days on Market have decreased from May (121). The number of homes sold has increased in June from 18 in May.

In the Town of Falmouth, the Average Sale Price has finally increased in June after a month over month decline that began in March. The number of new homes entering the market in May have increased indicating that Sellers are continuing to put their homes on the market. The number of homes sold have remained consistent however they are selling at a slower pace than they were in May.

In the Town of Chatham, home sales increased from May to June (from 14 to 33). This indicates as strong summer market for the beach town of Chatham. The Average Sale Price has decreased back under the million dollar bracket as the month of June came to an end. The Average Days on Market decreased significantly in June at 116 vs. 319 days in May. This shows us that homebuyers are ready to purchase and enjoy the summer months on Cape Cod.

In the Town of Yarmouth Port, property sales have remained consistent. The Average Days on Market have increased significantly since May however, there is still a lack of new inventory entering the market which could cause the average days on market to rise again.

If your town wasn't included in this report,
click here and let us know. We'll be happy to get you that data!
VIRTUAL SELLING
SOLD DURING COVID-19
Looking for your Dream Home?
*Market Information obtained from MLSpin, Cape and Islands MLS and Keeping Current Matters*


