


We have continued to crunch data from the South Shore and Cape Cod Association of Realtors® Multiple Listing Services (MLS) to help our clients and community better understand the state of the local real estate market.
Last updated 12/15/20
This report is for single family homes in Plymouth County and Barnstable County. Please note Condos, Multi-family homes and land are excluded.
New Listings: New listings inventory continues to remain down by 60% from this time last year. In 2019 - 1,035 listings were available in Plymouth County as of 12/15/19 whereas there are only 408 homes on the market as of today. There was a decrease of 4.4% in the number of new listings in Barnstable County year-to-date.
Price Changes: It is certainly still a Sellers market. Sellers are still not in a market where they need to be negotiating and they're are getting more money for their homes than they would have at this time last year. 48.47% less Seller's have adjusted their asking prices this year versus 2019. Price change data is currently unavailable for Barnstable County.
Pending Contracts: As of December 15th, there are more home sales pending up 1.32% from last year. This is the second month we have seen an increase since the beginning of the pandemic. The average days on market has continued to decrease as demand remains high in the current market. Pending data is currently unavailable for Barnstable County.
Closed Sales: A strong majority of 2020 has helped sold data remain rather unscathed throughout the pandemic as we continue to navigate a new normal. The market has continued to be extremely active since mid-May. Although there continues to be a decrease in closed sales, the numbers are not as vastly different as they were in previous months. In Barnstable County they saw, a year-to-date increase of 17.7% more sales year over year as of December 15th which shows that the market on the Upper Care is continuing to perform better this year than in 2019.
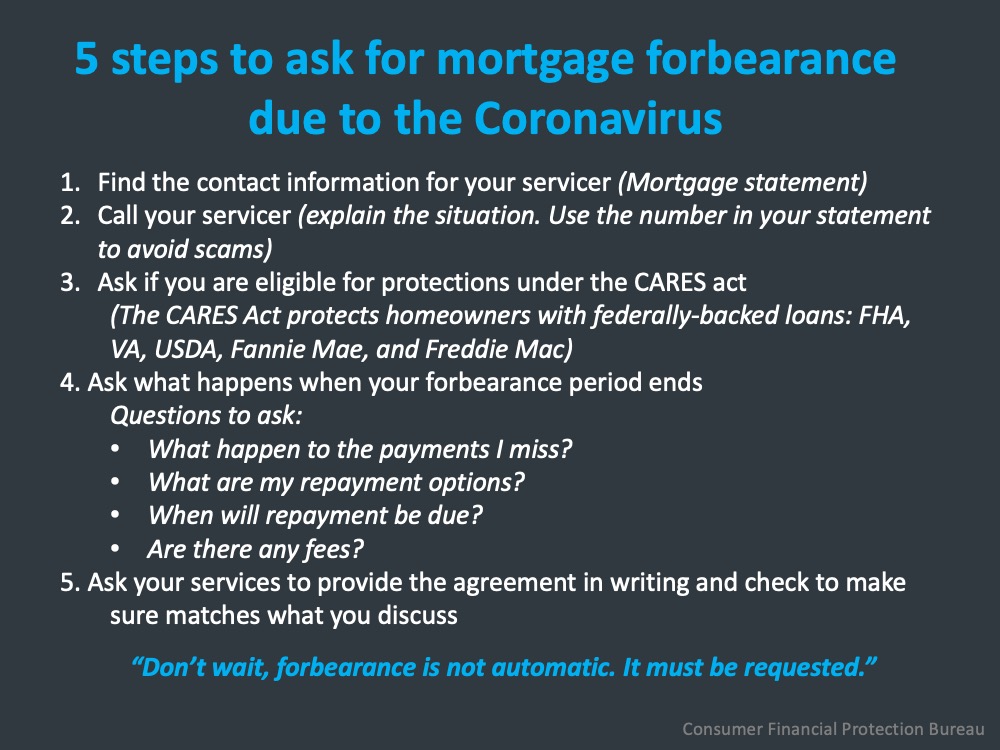
Mortgages: Mortgage rates have recently dropped again and remain lower than usual with a strong real estate market. Readily available mortgage types continue to be Conventional (Fannie Mae and Freddie Mac), Government (FHA and VA with tighter FICO score requirements), USDA, Mass Housing, Renovation and Jumbo (although some lenders don't have access to some of the bank investors that are doing them). First time home buyer rates are low right now and it's a great time to take advantage!
We are here to help: We are here for you to answer any questions and help you find solutions and possibilities during these uncertain, changing times. Please do not hesitate to contact us at [email protected] or call 508-746-0033.
What is the status of the current housing market?
Let's start by looking at this housing market recovery
index that we’ve been watching since the summer, during the pandemic. The four components of
this, demand, supply, price and time on market. We see that slight dip right around election time, but we see it coming back.
Now, why is this important? It’s important to remember right now that we’ve settled into a very active market. We’ve gone through the dashboard of pending deals, showings and mortgage applications all trending up. The one thing down is inventory right now however we're still
above that February first baseline that we saw earlier in the year.

We are starting to get a look at what’s happening to people as they come out of
forbearance. We’ve got a look from the MBA right here showing what
happened as people exited from their forbearance plan. The green, 54.6% of the people paid in full. They either made their monthly payments in this,
they paid off their loan or the past due payments were brought current upon the end. Those
are folks that you know maybe opted for forbearance but didn’t need it and were kind of able to weather
the storm that way.
The blue you see there, those are in some form of work out. 30.7% of those that went through a
modification or deferral in their loan. So those are folks who are saying it did what it was
intended to do for us. The red, 14.7% are in some form of trouble. They don’t have a loss
mitigation plan yet, or they’re in some kind of short sale type of situation.

What is happening with Home Prices & Inventory?
Are prices going up too fast right now? You
know, we’re seeing appreciation at a level that is asking many to say, can we sustain this in the market?
Is this something I need to be worried about? What’s going on with home prices?
Now, let's give this some perspective. If we look at compound annual home price
appreciation going all the way back to 1991, the average is 3.8% in annual home price
appreciation. If we look back to 2012, that number is considerably higher, 6.1% appreciation. So,
when you look at the average going back to ‘91 of 3.8%, and we look at 7%, that’s quite a jump. We look at it since 2012, not as much of a jump but still above that.
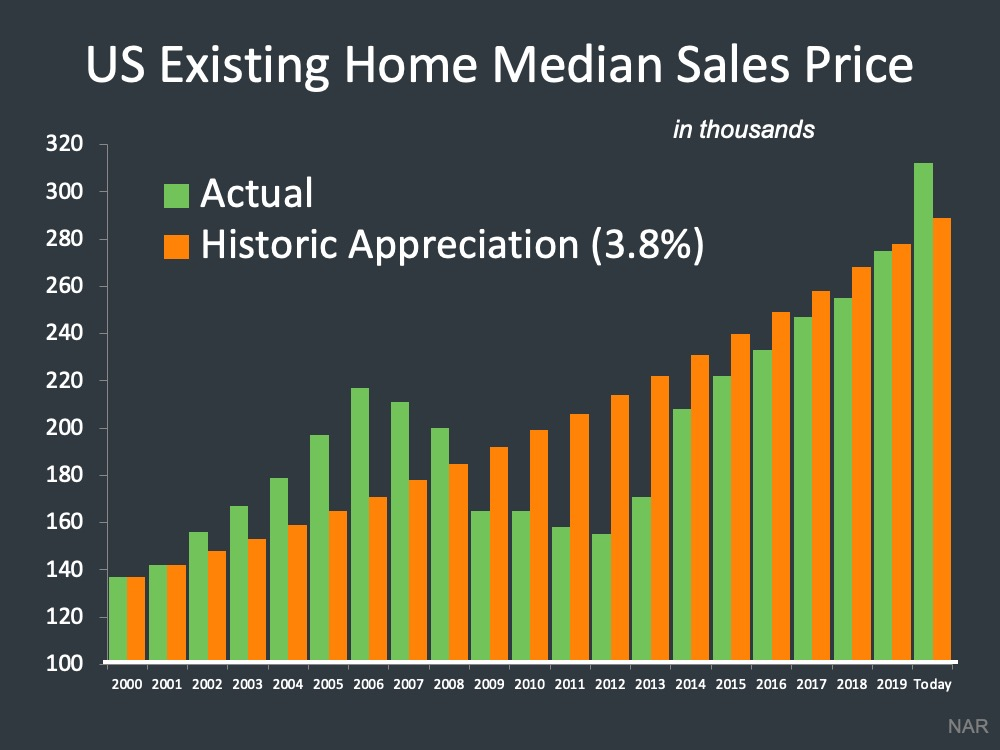
Now, if we were to start at 2000 and look at the historic appreciation,
3.8%, what would happen to home values if that just played out and the housing crash
doesn’t happen and just as we go through this “normal” market every year. That’s not reality but then we went ahead and laid in reality, of what happens in the market when we see this
run up in prices in early 2000’s, depreciation through the housing crash and then where we’ve been
going back to that chart since 2012 and where do we see ourselves today. We see that the actual
appreciation is outpacing the historic appreciation in this year.
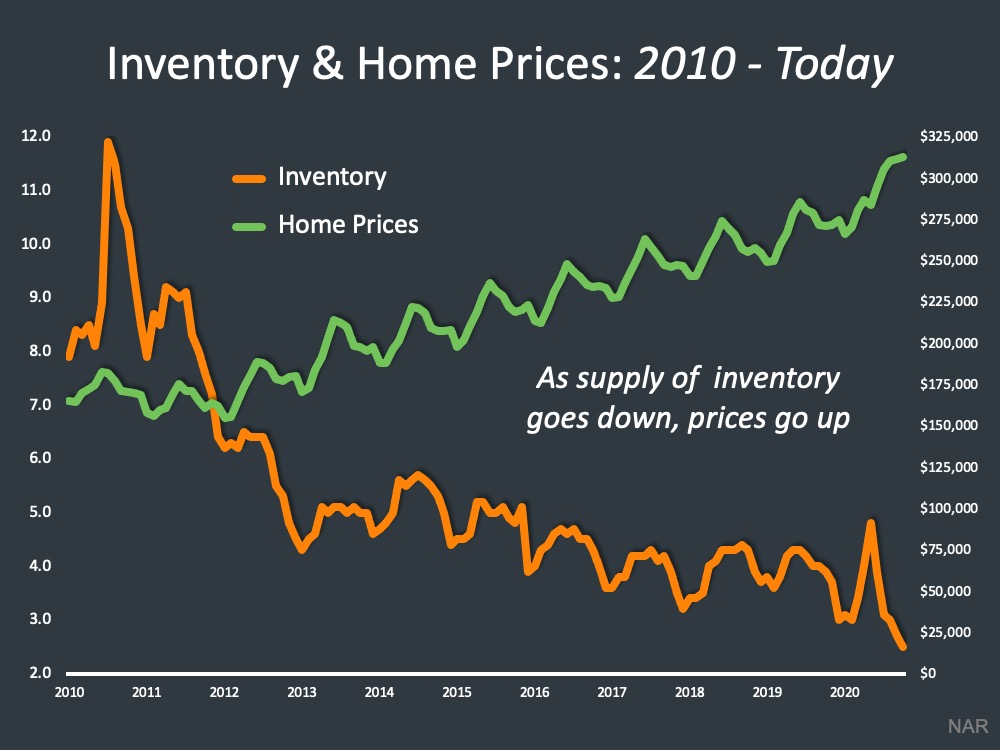
We want to give you a little bit of reasoning behind why we’re in that position right now across the country and it’s the story of inventory and home prices, and what has happened to both of those over the last ten years. If you look at this graph, this shows as the supply of homes on market goes down, the price has gone up. And even where we stand today with limited supply across the country and seeing home prices go up for a lot of different reasons.
Low interest rates are fueling buyer demand right now. The different needs that people
have through the pandemic for housing, fueling buyer demand. So many things putting pressure and that
lack of supply is keeping upward pressure on prices, pushing them higher
Here is a little perspective along these prices, and it comes from NAR’s Chief Economist Lawrence Yun. He says, “Such a frenzy of activity reminiscent of 2006 raises questions
about a bubble and the potential for a painful crash. It’s on a lot of people’s minds. The answer? There is
no comparison. Back in 2006, dubious adjustable rate mortgages taxed many buyers’ budgets. Some loans didn’t even require income documentation. Today, buyers are taking out 30 year fixed rate mortgages. 14 years ago, there were 3.8 million homes listed for sale, and home builders were putting up about two million new units. Now, inventory is only about 1.5 million homes, and homebuilders are underproducing relative to historical averages.”
So, when we were back in the housing crash, that oversupply that we talked a lot about in the last several
months led to a lot of challenges in the market. Where are we at today? We’re in an undersupply
scenario, on a very different lending environment across the country and we’re seeing appreciation.
Another headline that we're likely going to see relative to this is, mortgage debt in the country soaring to close to $10 trillion. That’s obviously a big number. Many people will say okay, here we go again - prices are appreciating at an unsustainable rate, mortgage debt is soaring. If we go look back at the Federal Reserve Bank - "Mortgage balances, the largest component of
household debt, rose by 85 billion in the third quarter and sat at 9.86 trillion on September 30th.Mortgage originations, which include refinances, were at 1.05 trillion, the second highest volume in the
history of the series, and second only to the historic refinance boom of the third quarter of 2003."
So, as
we start to see all these refinances come in, we see volume come in, we’re seeing more mortgage debt. It’s important to remember that mortgage debt is going to rise as more homes are built, and as
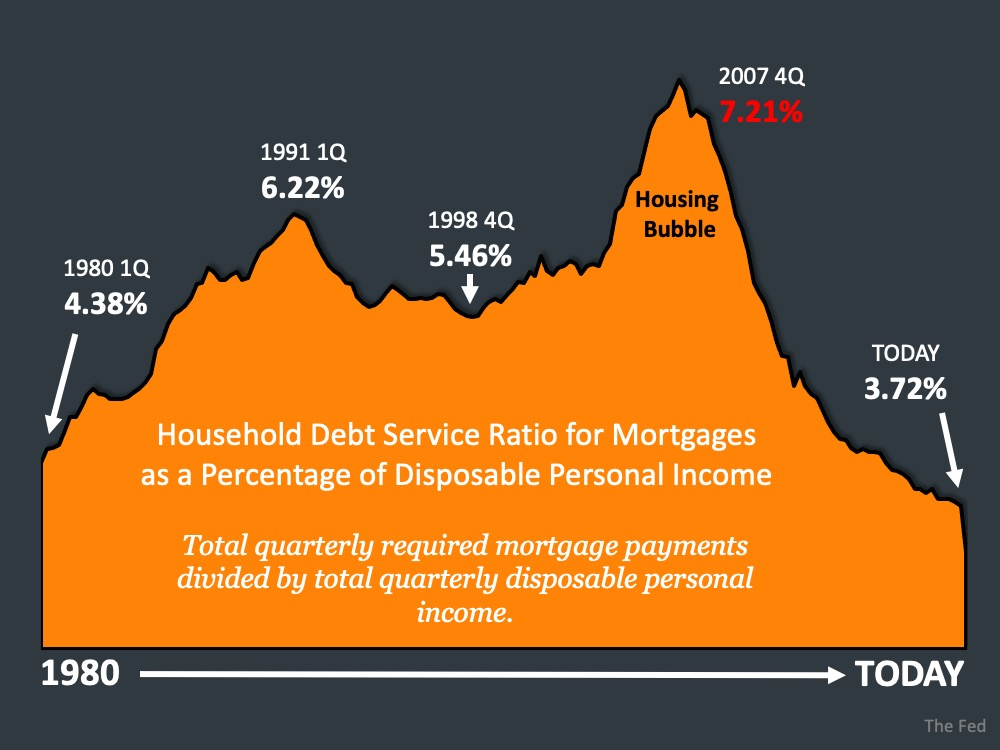
those homes appreciate and more homes are sold. What we want to really look at is the
debt service ratio. Here is a graph provided by the Fed of household debt service ratio for
mortgages as a percent of disposable personal income.
We look all the way back to 1980 and you can see there, where we stand today is lower than where
we were in the ‘80s and ‘90’s and certainly in the early 2000’s when we peaked at over 7%. Today we
sit at 3.72% of disposable income committed to a mortgage payment. Why is that? That is the effect of
lower interest rates and rising wages.
Looking ahead to 2021...
Keeping in mind projections for next year and the coronavirus, by mid-year, a majority of
the population could be vaccinated. We’re going to have to see that play out and how that happens across the country. As people have more certainty. As we started this pandemic off and people questioned are people going to go
back to work, or are they going to all work from home now? There’s probably some hybrid models in
the middle that once people get certainty to, they can
make decisions relative to housing.
A lot of this is going to depend on the path of the coronavirus and what we have going on throughout the country. We’re in a place right now where certainly cases are rising but as we look forward, the thought
that always comes to mind is, it’s darkest before the dawn. There’s hope around the corner,
and we’re certainly looking to the future for that!

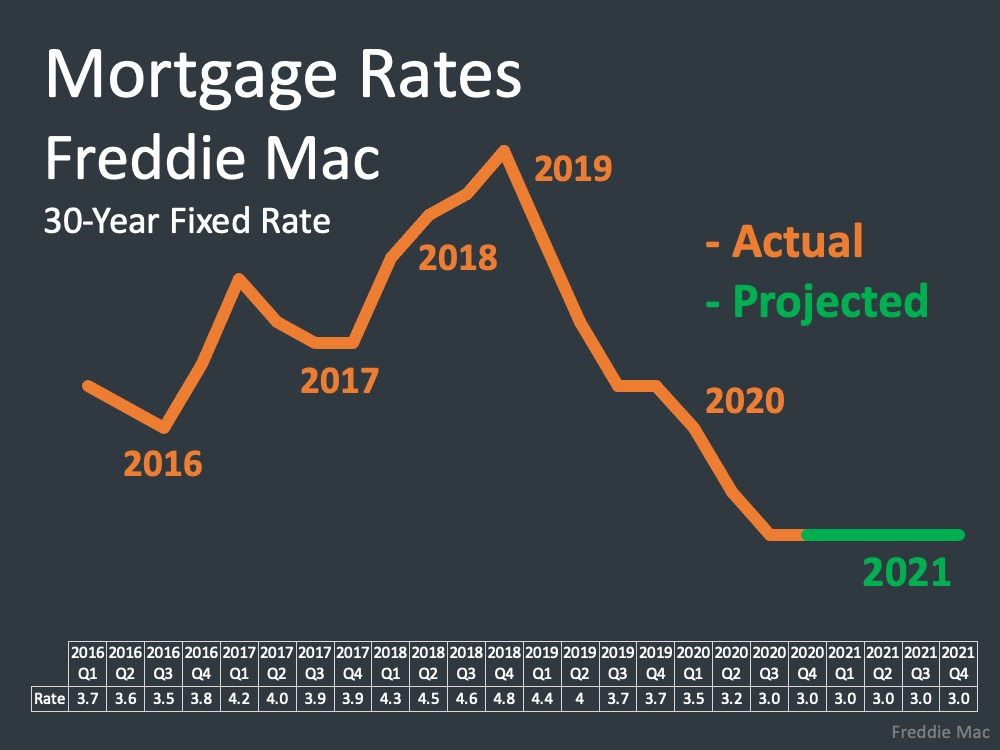
If we look at projections for mortgage rates, Freddie Mac has come out with their projections through the fourth quarter of next year. They’re saying that we’re going to stay around 3% for a 30 year fixed. Whether that has slight changes and we’re at 2.7, 2.8, bouncing around there, look at the bigger picture here of where we were in 2016, ‘17, up to ‘19, and where we are today.
Definitely a favorable lending environment for those looking to purchase a home as compared to the last couple of years. This year we’ve gone through 14 lows in the average 30 year fixed as measured by Freddie Mac. That’s not just this year, its since they’ve been recording those.
So, next piece of information from Danielle Hale talking about the volume of homes sold. She says, “We expect sales in 2021 to come in 7% above 2020 levels.”
We’re going to sell more homes this year than we did last year in the middle of a pandemic, and sell even more going into 2021. Why? Because needs are changing. People are saying with these low rates, we’re going
to go out and buy. There are going to be a lot of people that say we held off in listing our home this year
or selling our home because we felt unsafe for whatever reason now putting their home on the market.
So again, the coronavirus will dictate what we see there as the vaccine is made available. As we go into 2021 looking like more normal patterns. Now, that’s
yet to be seen relative to the spring and the summer, it's likely as we get that
information and people feel more safe, then we’ll start to see more volume and more transactions.

LET'S TAKE A CLOSER LOOK AT HOW YOUR TOWN DID IN THE MONTH OF NOVEMBER ⤵️
In the Town of Plymouth, home sales decreased decreased from 108 sales in October. The Average Days on Market has dropped from over 2 months in October to just over 1 month in November. The Average Sale Price has also dropped from $576k in October.

In the Town of Hingham, the number of new homes entering the market has continued to decrease month over month. Homes spent less time on the market during November than they did in October. The Average Sale Price remains in the million dollar bracket month over month with a slight increase from $1.2m in October.

In the Town of Scituate, the Average Sale Price increased by just over $50,000 in November. Home sales remain consistent however they spent a bit more time on the market than they did in October. The number of new offerings decreased in November.

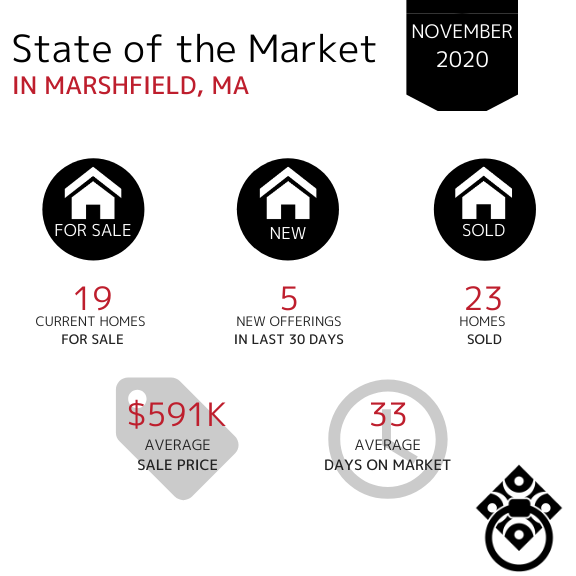
In the Town of Marshfield, the number of homes sold decreased by 50% during the month of October. Properties are selling at a slightly faster pace - spending just about a month on the market. The Average Sales Price has decreased for the first time in the last few months.
In the Town of Kingston, the number of new homes for sale and the number of homes sold in the month of November has remained consistent. The Average Days on Market increased in November and the Average Sale price increased from $524k in September and October.

In the Town of Duxbury, the Average Sale Price of homes has decreased for the first time since August and no longer remains in the million dollar bracket. Available inventory has decreased as well as the Average Days on Market in November.

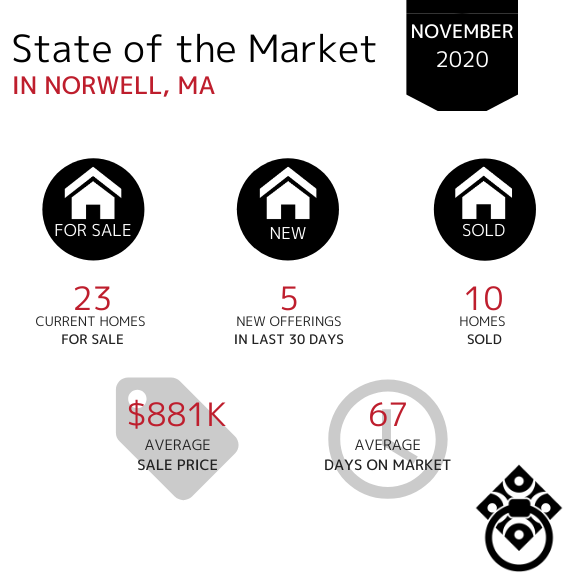
In the Town of Norwell, the Average Days on Market have increased in the month of November from 40 days in October. There has been a consistent amount of inventory from April through November for the town of Norwell. The number of homes sold in the month of November was slightly lower than in October. The Average Sale Price remains in the high $800s range through November.
In the Town of Cohasset, the amount of available inventory has remained consistent over the last three months which shows a steady market. The number of days on market has increased from 27 days in October. The Average Sale Price remains in the million dollar bracket month over month, slightly higher than September and October.

In the Town of Hanover, the number of homes sold increased in the month of November up from 16 sold in October. The Average Days on Market has increased and the Average Sale price has increased by $41,000.

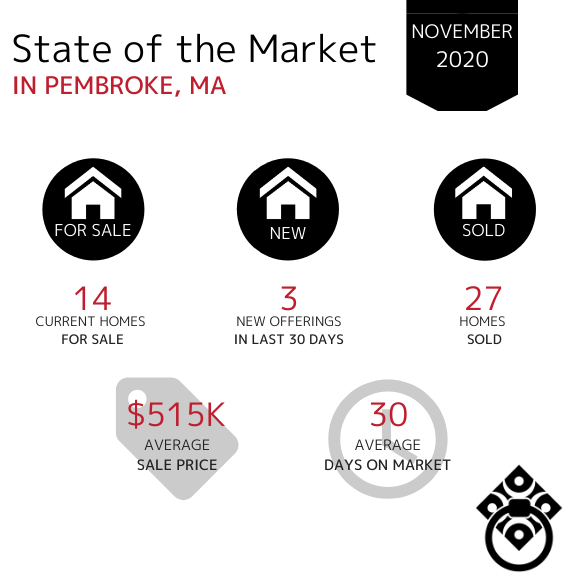
In the Town of Pembroke, the amount of new offerings in the last 30 days decreased by half. The Average Days on Market decreased from 54 days in October. The Average Sale Price has increased from the mid $400,000s in October.
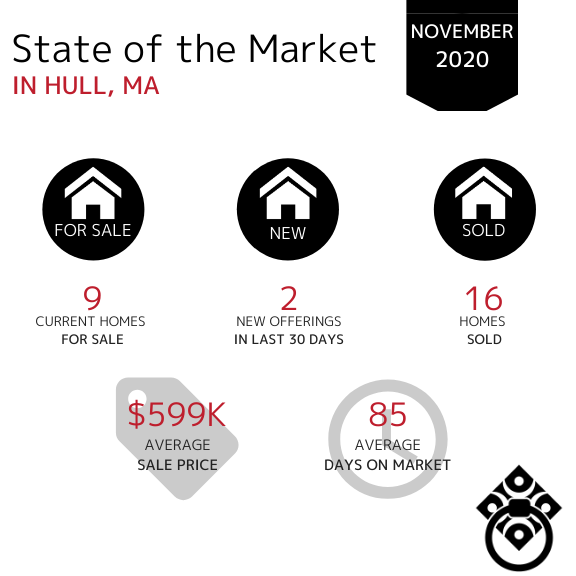
In the Town of Hull, the number of homes sold increased slightly in November. Homes entering the market have slowed down and there is significantly less inventory available.
The Average Days on Market increased from 62 days in November and the Average Sale Price has decreased by $125k.
In the Town of Bourne, the amount of available inventory has decreased month over month. The Average Days on Market has remained consistent which tells us that the buyer demand is there however the lack of inventory is hindering them buying at an even faster pace. The Average Sale Price has decreased in the month of November.

In the Town of Sandwich, the Average Days on Market significantly decreased from 69 Days in October. The number of homes sold has remained consistent month over month however there is less inventory available on the market.

In the Town of Mashpee, the Average Sale Price has increased into the million dollar bracket in November from $801,000 in October. The Average Days on Market have decreased again from 89 in October. The number of homes sold has remained fairly consistent since July with just a slight decrease in November.

In the Town of Falmouth, the Average Sale Price has decreased slightly but remains in the mid $700,000s. The number of new homes entering the market in September has decreased slightly as well. The number of homes sold has decreased although not drastically.

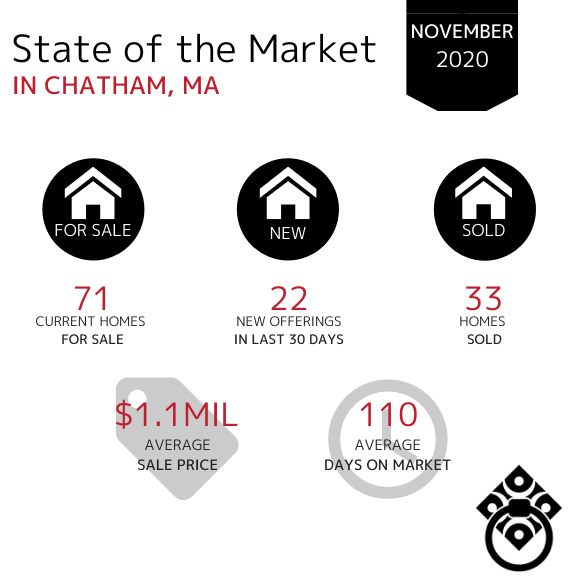
In the Town of Chatham, home sales increased slightly from 27 homes sold in October. The market in Chatham is remaining consistent with throughout the last three months. The Average Sale Price has remained in the million dollar bracket over the last 4 months with a slight drop from $1.4m in October.
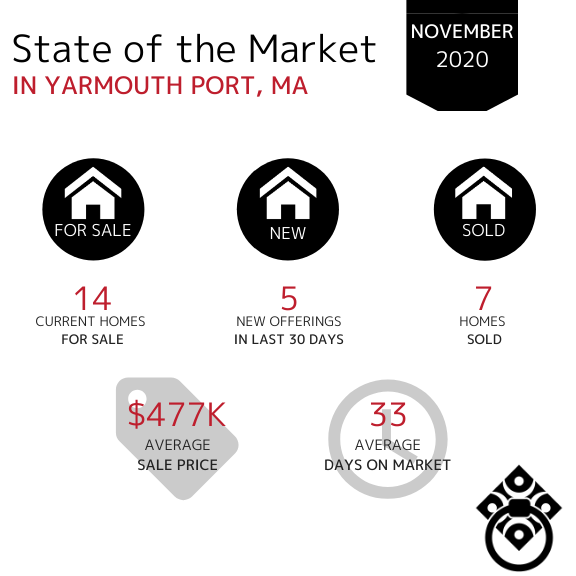
In the Town of Yarmouth Port, property sales have decreased again. The Average Days on Market remains consistent although the number of new homes and current homes for sale have decreased since October.
If your town wasn't included in this report,
click here and let us know. We'll be happy to get you that data!
VIRTUAL SELLING
SEARCH FOR HOMES
Looking for your Dream Home?
*Market Information obtained from MLSpin, Cape and Islands MLS and Keeping Current Matters*
Basic Text Object
Lorem ipsum dolor sit amet enim. Etiam ullamcorper. Suspendisse a pellentesque dui, non felis. Maecenas malesuada elit lectus felis, malesuada ultricies. Curabitur et ligula. Ut molestie a, ultricies porta urna. Vestibulum commodo volutpat a, convallis ac, laoreet enim. Phasellus fermentum in, dolor. Pellentesque facilisis. Nulla imperdiet sit amet magna.


