


We have continued to crunch data from the South Shore and Cape Cod Association of Realtors® Multiple Listing Services (MLS) to help our clients and community better understand the state of the local real estate market.
Last updated 11/11/20
This report is for single family homes in Plymouth County and Barnstable County. Please note Condos, Multi-family homes and land are excluded.
New Listings: New listings inventory is down by 60% from this time last year. In 2019 - 1,374 listings were available in Plymouth County as of 11/11/19 whereas there are only 538 homes on the market as of today. There was a decrease of 5.8% in the number of new listings in Barnstable County year-to-date.
Price Changes: It is certainly still a Sellers market. They are still not negotiating in the current market and are getting more money for their homes than they would have at this time last year. 49% less Seller's have adjusted their asking prices this year versus 2019. Price change data is currently unavailable for Barnstable County.
Pending Contracts: As of November 11th, there are more home sales pending, this is the first increase since the beginning of the pandemic. The average days on market has continued to decrease as demand remains high in the current market. Pending data is currently unavailable for Barnstable County.
Closed Sales: A strong majority of 2020 has helped sold data remain rather unscathed throughout the pandemic as we continue to navigate a new normal. The market has continued to be extremely active since mid-May although there continues to be a decrease in closed sales however the number are not as vastly different as they were in previous months. In Barnstable County they saw, a year-to-date increase of 15.6% more sales year over year as of November 11th shows that the market on the Upper Care is continuing to perform better this year than in 2019.
Mortgages: Mortgage rates have recently dropped again and remain lower than usual with a strong real estate market. Readily available mortgage types continue to be Conventional (Fannie Mae and Freddie Mac), Government (FHA and VA with tighter FICO score requirements), USDA, Mass Housing, Renovation and Jumbo (although some lenders don't have access to some of the bank investors that are doing them). First time home buyer rates are low right now and it's a great time to take advantage!
We are here to help: We are here for you to answer any questions and help you find solutions and possibilities during these uncertain, changing times. Please do not hesitate to contact us at [email protected] or call 508-746-0033.
How have consumers reacted to the current market?
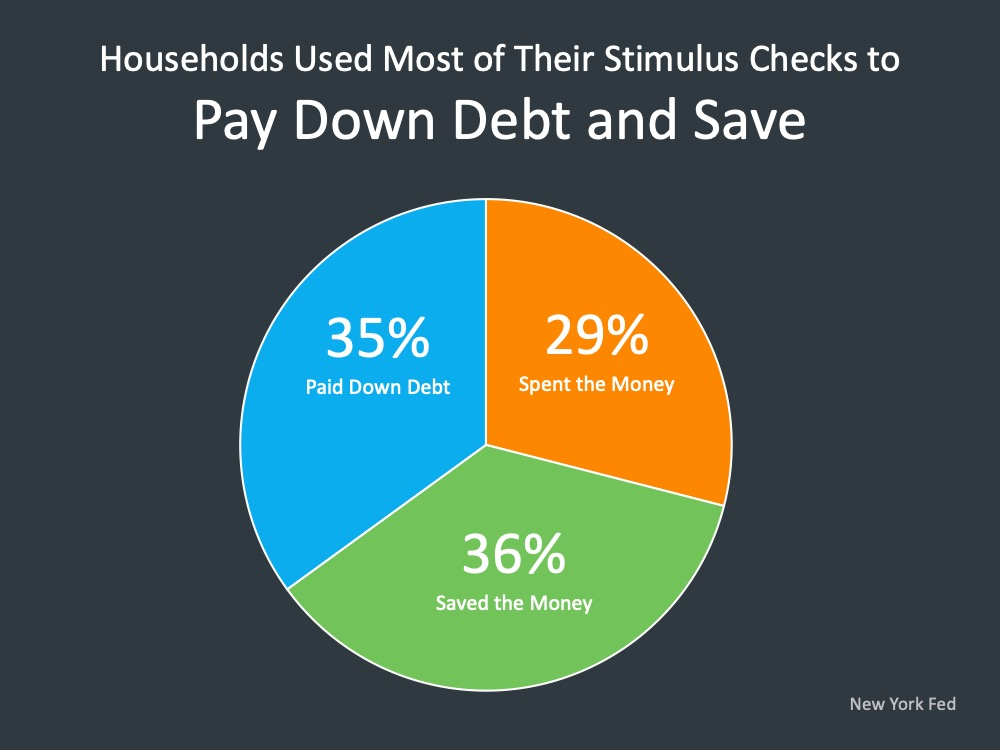
Over the summer during the coronavirus pandemic, the average FICO score in this country has actually risen, which may be shocking to a lot of people. These are not people that are in process for a home loan or FICO scores of people that are applying for a mortgage. These are average consumers. We’ve seen it slightly rise over the summer months and why is this? There’s a very specific reason for that; most households have used their stimulus check to pay down debt and to save.
35% percent of those receiving stimulus used it to pay down debt, to retire debt. 36% saved that money. You’ve probably seen some news stories about deposits rising across the country. This shows us that a lot of people, two out of three almost, used it to pay down debt or save, thereby improving their financial situation, raising their FICO score, and giving them a better situation going forward.
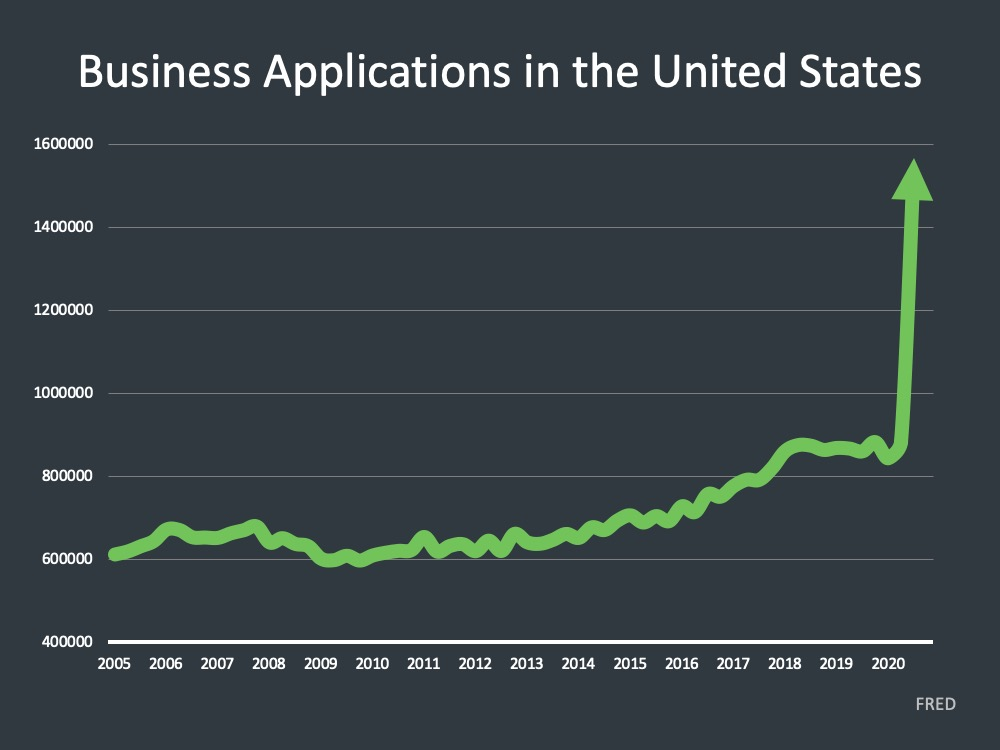
Another thing that’s very interesting about the world that we live in right now relative to business, is
the number of business applications across the U.S. has skyrocketed this year. Which is really a tribute
to innovation across the country as people have seen here’s a need through the pandemic; they can shift their business, create a business, do something different to be able to meet the need of consumers
in today’s market.
There is no doubt there have been a lot of businesses that have been impacted in a
negative way going through the pandemic, but there’s been so much response of people saying I’m
going to start a business. I’m going to do something that’s going to serve a need in this country. It’s no
different than the housing crash back in 2008. A lot of the great companies that are around today were
started and that innovation was birthed during the downturn of the Great Recession. So, this is positive news relative to businesses and people starting businesses to innovate and meet a need
through this health crisis that’s caused an economic crisis across the country in the year that is 2020.
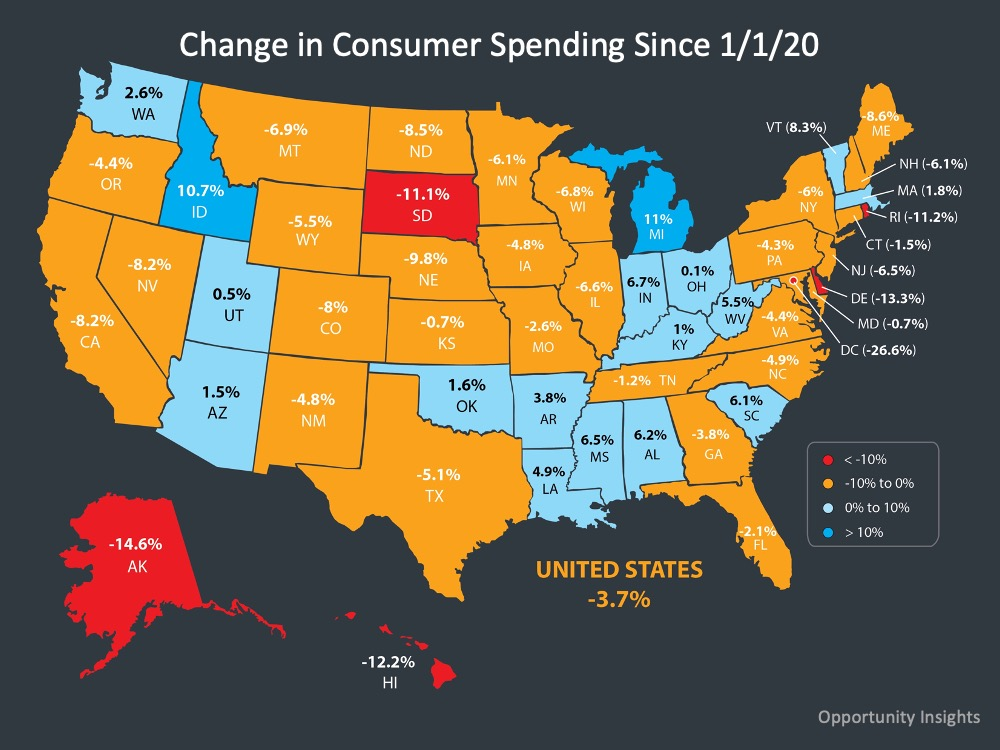
Now, the interesting thing as we look across the country at consumer spending, we know that in a large majority of states that consumer spending is very near to where it was at the first of the year.
So, we go back to January 1st and we look at where consumer spending is now as compared to that, you can see no matter what state you’re in where you’re at relative to consumer spending.
The country as a whole is within 3.7 percent of where we were on January 1st.
There is likely to be another stimulus package passed, which is going to help consumer spending and going to help push the economy forward as we see a rise in coronavirus cases, a rise in things going into these winter months. and we can be encouraged with consumer spending across the country and where that’s at, and hopefully seeing that recover as we continue on throughout the year.
What is happening with Unemployment?
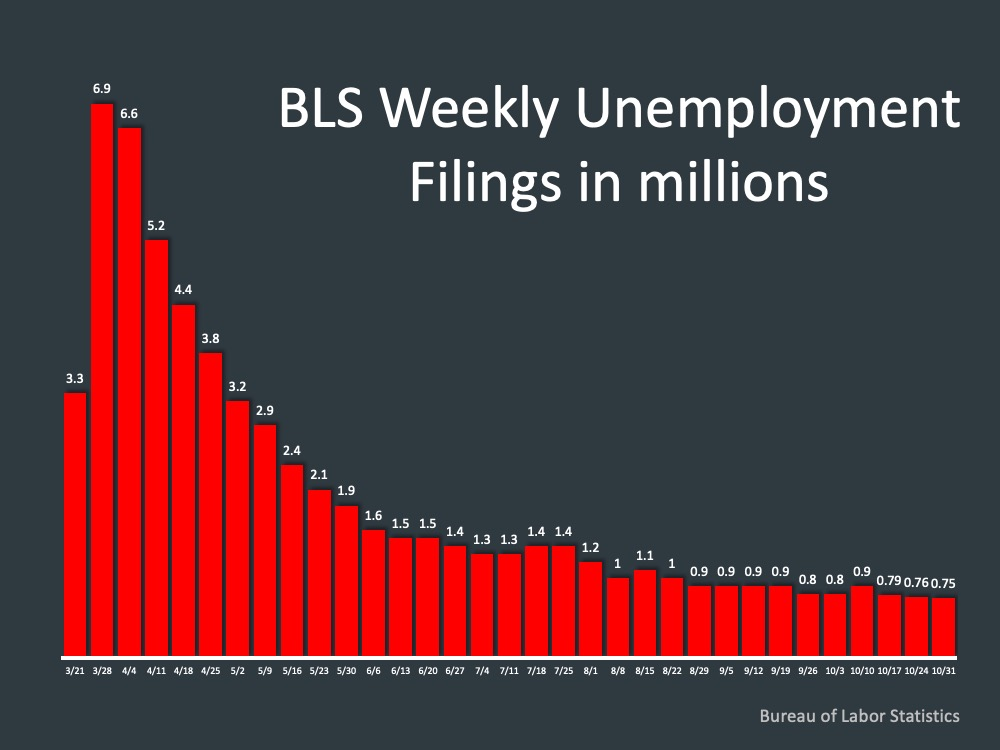
Now, the question that’s on a lot of people’s minds, things we’ve talked about over the summer, is
unemployment. Weekly
filings for unemployment, the weekly claims across this country since this started in late March (see graphic). As
you look at this you can see kind of where we’ve been, and certainly the height towards the end of
March around 7 million people in one week claiming unemployment. Most recently, about 750,000
claiming unemployment in the most recent weeks.
We’ve been in this area for the last couple of
months, around eight or nine hundred thousand people filing for unemployment each week. We want to
see that continue to come down, but we’re hovering in that area. The interesting thing about
that is as people continue to apply for unemployment, people are getting their jobs back and coming off
of unemployment.
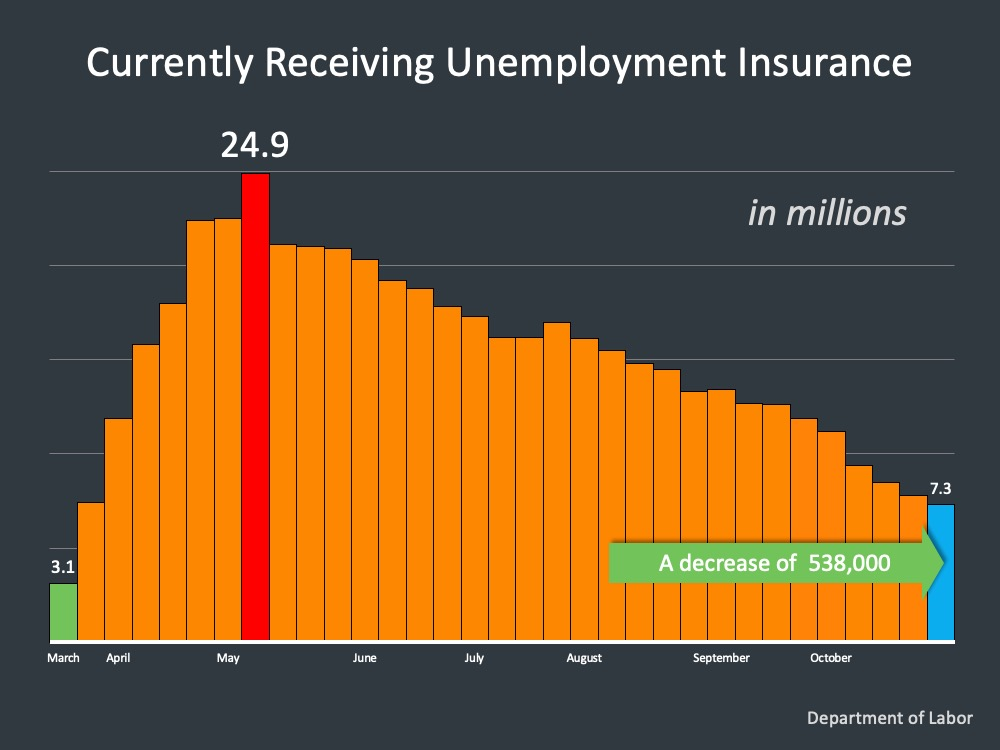
This is a look at those currently receiving unemployment insurance. So, if you go back to May, the height of this, we saw almost 25 million people receiving unemployment insurance. Most recent count, about 7.3 million. And while we’ve hovered in that eight or nine hundred thousand people applying in that range, each week there you can see there has been a decrease of those receiving unemployment insurance. Most recently about 500,000 of those coming off, for a total number of about 7.3 million
receiving unemployment insurance. It's not the goal however we're watching that number come down, which is good.
What is happening with Foreclosure/Forbearance?
We look at forbearance across the country as the tool given to consumers to help weather the storm
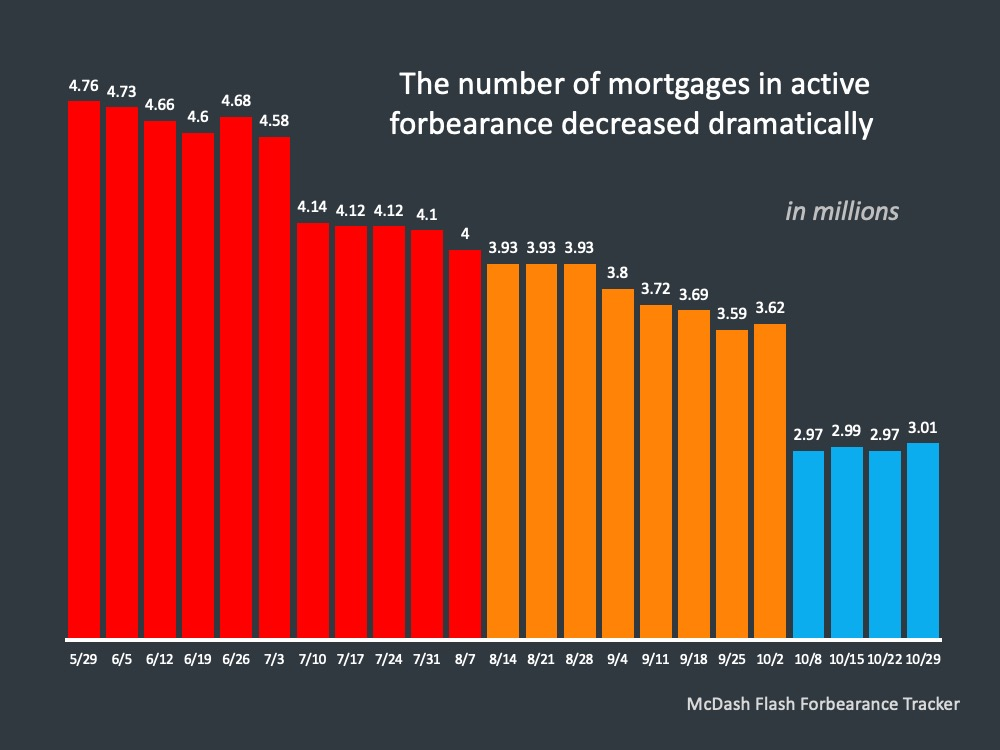
relative to their housing. If you go back to the end of May, just over 4.7 million people on active
forbearance. The number total is a little bit higher than that of people that have taken it. As we look at over time, the number of people in active
forbearance is decreasing, and quite dramatically decreasing. Its this step down in October where
you see right at 3 million people for the last several weeks on active forbearance.
Now, as we see that
we want to continue to see people come off. If you remember, the CFPB gave options for people as their
first term, first 180 days of forbearance expire. They could extend, they could do a number of different
things, and we’re going to talk about those people in a minute. But the good news is we’re seeing people
come off of the forbearance program.
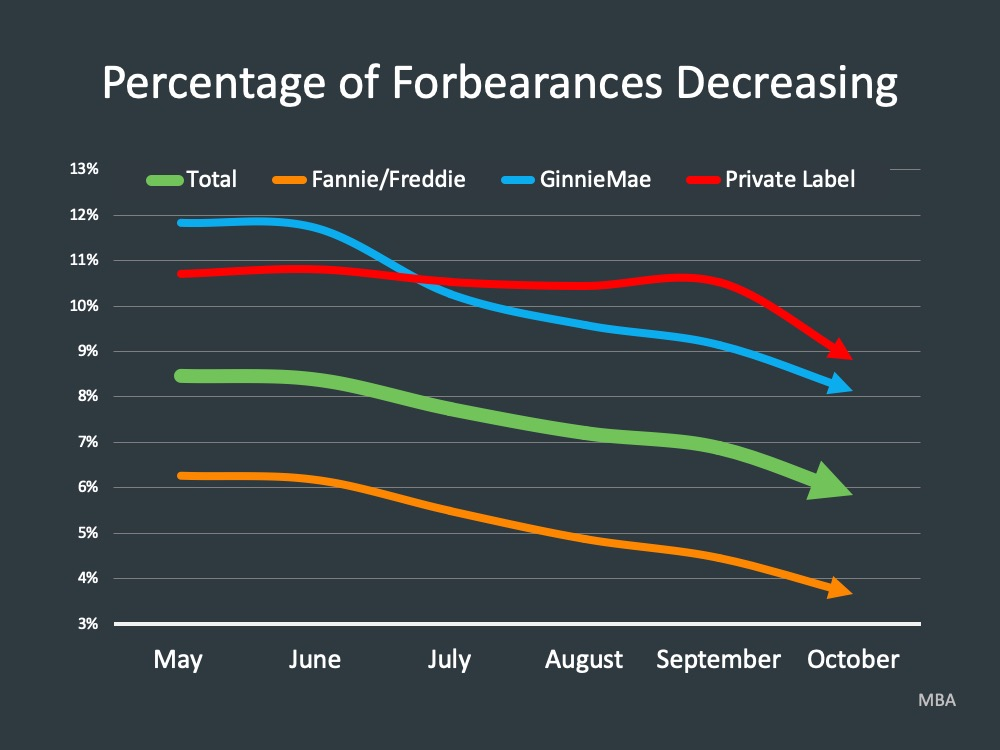
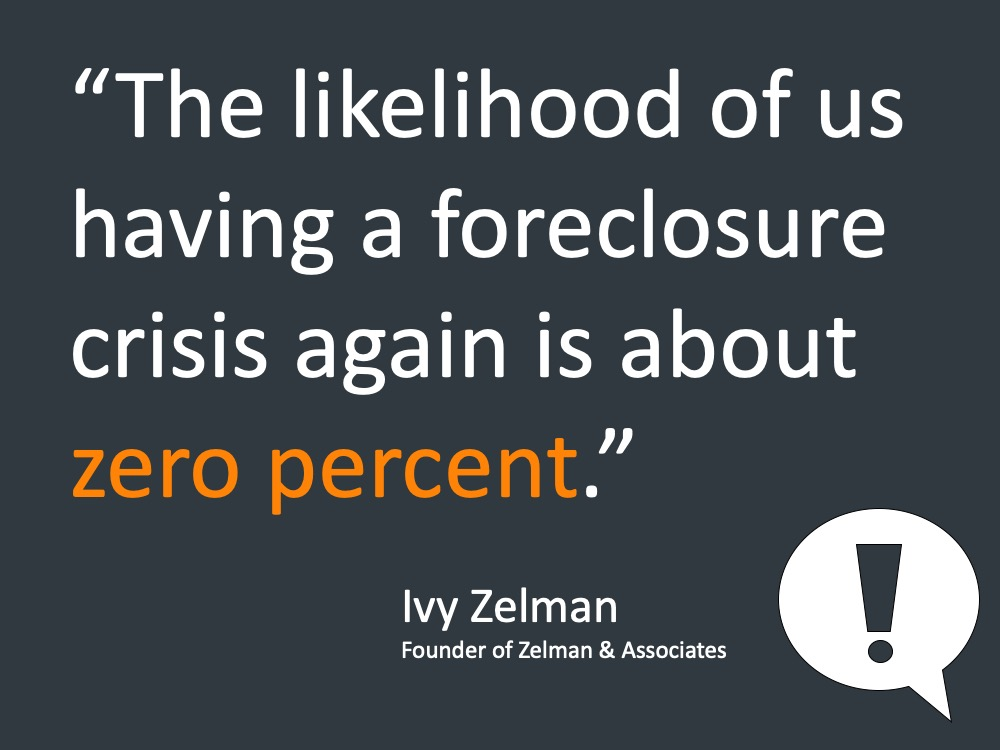
A lot of experts were saying hey we’re going to see 30% of homeowners take forbearance. That actually never happened. Back in May we reached this height of about 8.5% of mortgages in forbearance. Where we sit today is 5.8 percent of mortgagees in forbearance, and that number is dropping. So, all of these loans that are going to go into forbearance never happened, and we see quite the opposite of that. A fraction of those, and that number dropping.
What we know as well is the percentage of forbearances by product type is decreasing - look at Fannie, Freddie, Ginnie, and then private mortgages, all of those things dropping.
Now, as we see these mortgages starting to come off of forbearance and decrease, that in itself is not the
complete answer to are we going to see a housing crash, because there are a lot of people that are
affected by this.
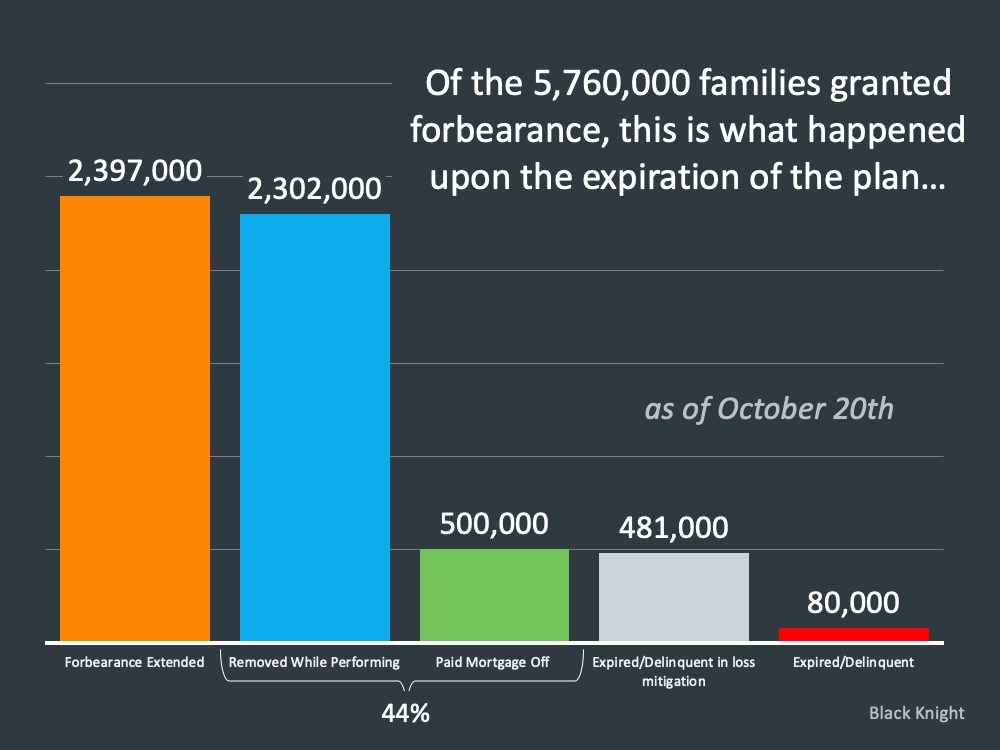
As of October 20th,
of the 5.7 million families granted forbearance, this is what happened upon the expiration of the plan.
The orange bar all the way over, nearly 2.4
million extended their forbearance. As we mentioned earlier, the CFPB built in a provision to what they
deemed request and be given an extension of 180 days. So, your first initial 180 days, you can get an
extension for another 180 days for a total of 360 days on your mortgage.
The next group - blue and green bars - 44% of mortgages
either were removed while they were performing. These are the people that took it and
said we don’t need it - we’re going to move on. They’re performing on their mortgage.
Five hundred thousand paid off their mortgage through this process. Now, we don’t know the
breakdown of those, the number of people that sold and maybe there are people in there that said you
know what, we can’t hold on to the house, we’re going to sell it. But certainly people that their mortgage
was paid off during that time, 44% of those expired while performing or paid their mortgage off.
Now the grey bar - 481,000 people expired while delinquent and are in some form of
loss mitigation. Think about this as a workout with their bank, tacking these payments on the end, doing
things that help them survive this and the bank saying they're going to help you work through this
and use the forbearance plan for the way it was intended. That’s a good thing.
The last tranche there, 80,000 people expired while delinquent and are not in some form of loss mitigation.
.png)
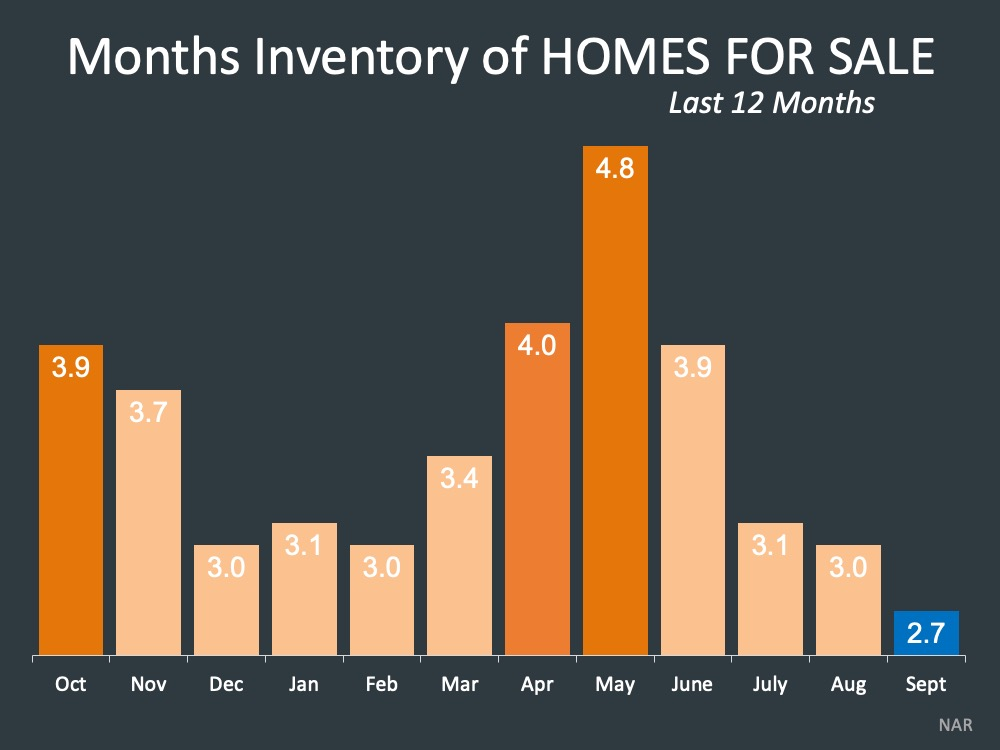
What is happening with Inventory?
It’s a very interesting look at the last 12 months of inventory across the country. Most
recently, 2.7 months of inventory across the country, and likely lower in a lot of cases. As we go
through these winter months we know that the deficit of inventory is the biggest impact to the industry.
We’ve talked a lot about the economic impact of a home sale across the country,
and we know that’s driving the economy right now. If we take a look at the year over year change in listings, it’s the look at
supply of homes coming to market versus the inventory of homes in the market. New listings, is the supply coming into the market and as this supply comes in, it gets purchased as fast
or faster than it comes to market, leaving this inventory number flat.
Hopefully maybe bottoming out
and coming up a little bit. But still severely under inventory across the country today.
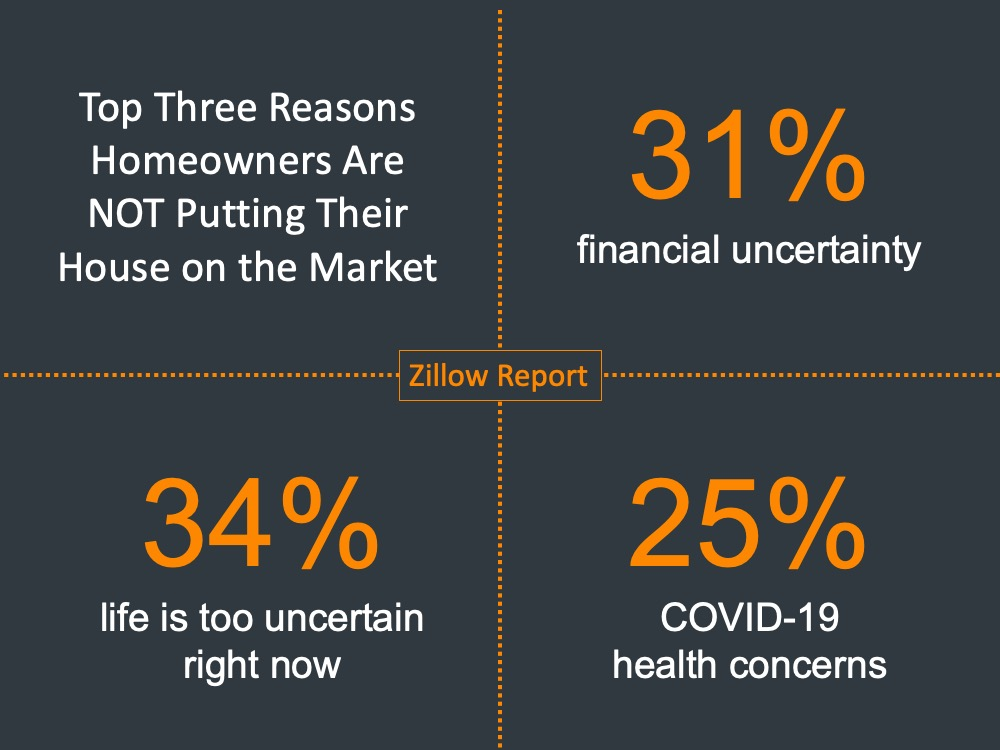
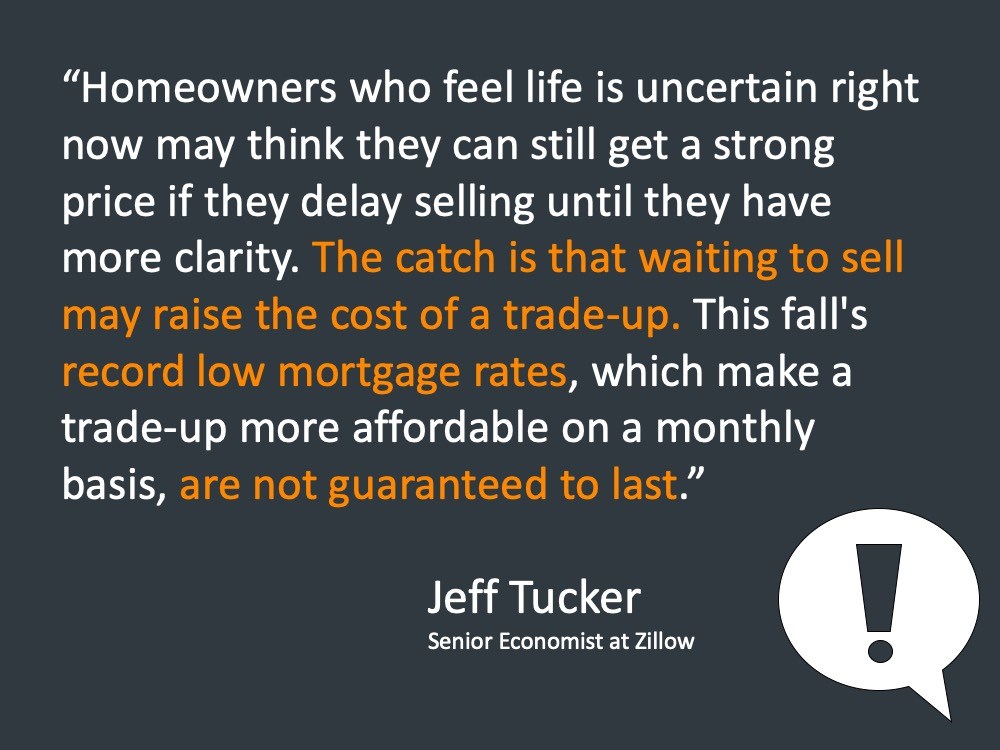
Zillow just came out with a study last week of the top three reasons homeowners are not putting their homes on the market, which is very interesting.
31% say financial
uncertainty is a reason we are not putting our home on the market.
34% say life is too uncertain right now and you can’t argue with that. There’s a lot of
uncertainty in the world.
The reality
is in feeling uncertain right now there will be a cost to waiting for certainty. A quarter of people, 25% of people say I have concerns about my health and bringing people into the house relative to
COVID.
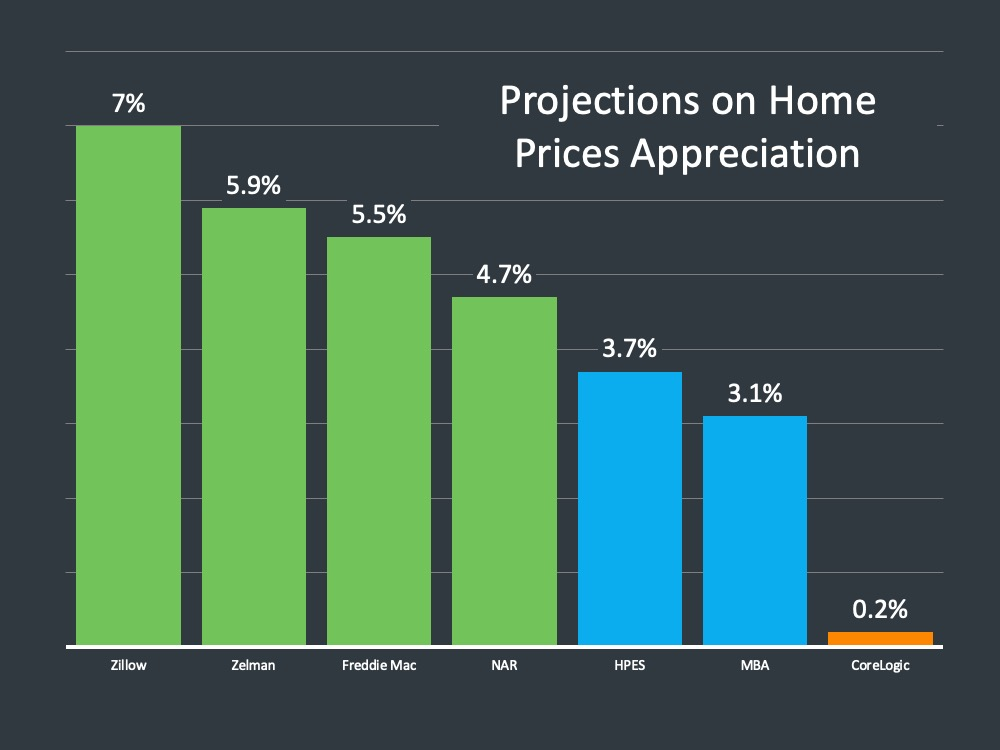
As we look into the future right now, what we can see, the projections on home
prices is very positive.
As we look at this graph - Zillow at one end, MBA on the other end, a lot of people in the middle, 4% appreciation going into next year. Again, going back to if you wait for that certainty you’re
going to be seeing appreciation going into next year. So, the same house is going
cost you more relative to that. So, the price is going to be higher and the cost ultimately determined by
rising mortgage rates, is going to be higher.
The MBA’s most recent forecast has come out and
forecasted 3.3% next year, 3.639% in the years following. Which, you can look at as a changing rate but not a higher interest rate on a 30-year fixed. It’s a very good interest rate. The reality of
the place that we live in today and interest rates, it makes a 4.5% or a 5% mortgage look very high.
It’s going up in price and the interest
rate is going up and that will be the price of waiting for certainty in the market.
LET'S TAKE A CLOSER LOOK AT HOW YOUR TOWN DID IN THE MONTH OF SEPTEMBER ⤵️
In the Town of Plymouth, home sales decreased slightly in the month of October. The number of Average Days on Market has risen again however the Average Sale Price increased from $489k in September.
Homes entering the market have increased through October.

In the Town of Hingham, the number of new homes entering the market has decreased. Homes spent more time on the market during October than they did in September. The Average Sale Price remains in the million dollar bracket month over month.

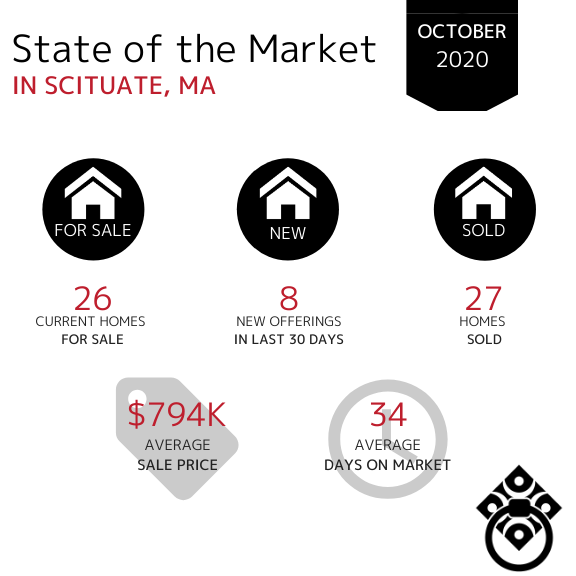
In the Town of Scituate, the Average Sale Price decreased by $100,000 in October. Home sales also decreased however they're spending less time on the market. The number of new offerings has increased by 50%.
In the Town of Marshfield, the number of homes sold during the month of October increased. Properties are selling at a slightly slower pace - spending just over a month on the market. The Average Sales Price has remained consistent month over month.

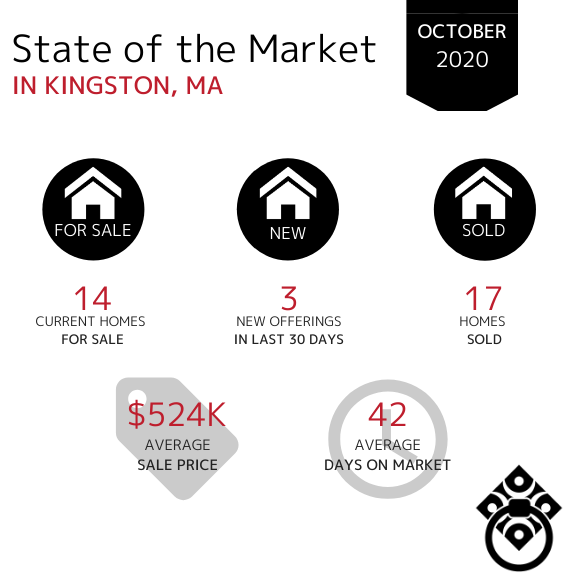
In the Town of Kingston, the number of new homes for sale has remained consistent with a very slight decrease since September. The number of homes sold increased which shows us that buyers are still actively purchasing homes. The Average Days on Market decreased from 53 in September and the Average Sale price increased from $524k in September.
.png)
In the Town of Duxbury, the Average Sale Price of homes has remained in the million dollar bracket since August and has increased from $1m in September. Available inventory has decreased while the Average Days on Market have increased by more than half in October.

In the Town of Norwell, the Average Days on Market have increased slightly since September. There has been a consistent amount of inventory from April through October. The number of homes sold in Norwell in the month of October was slightly lower than in September. The Average Sale Price has increased from September by $43,000.

In the Town of Cohasset, the amount of available inventory has remained consistent over the last two months which shows a steady market. The number of days on market has decreased from 119 in September. The Average Sale Price remains in the million dollar bracket, slightly lower than September which was at $1.5M.

In the Town of Hanover, the number of homes sold has remained fairly consistent. The Average Days on Market has decreased again from 43 in August and 34 in September to just under 1 month. The Average Sale price has decreased by nearly $100,000.

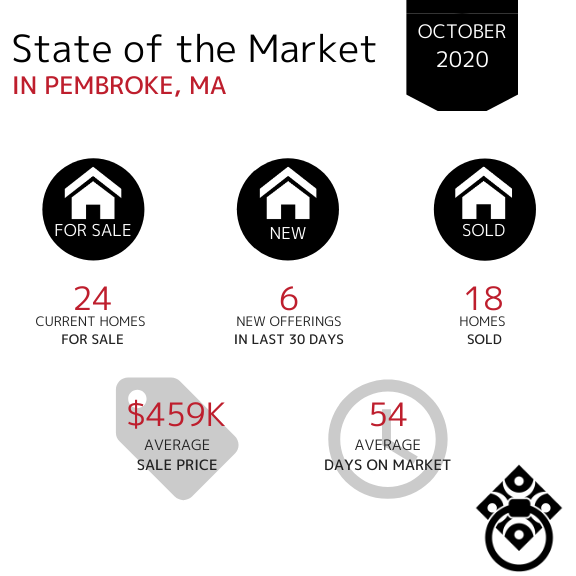
In the Town of Pembroke, the amount of new offerings in the last 30 days have increased however the total amount of homes for sale has remained consistent which indicates that homes are still selling and entering the market simultaneously. The Average Days on Market increased from 36 days in September. The Average Sale Price has decreased from the mid $500,000s in September.
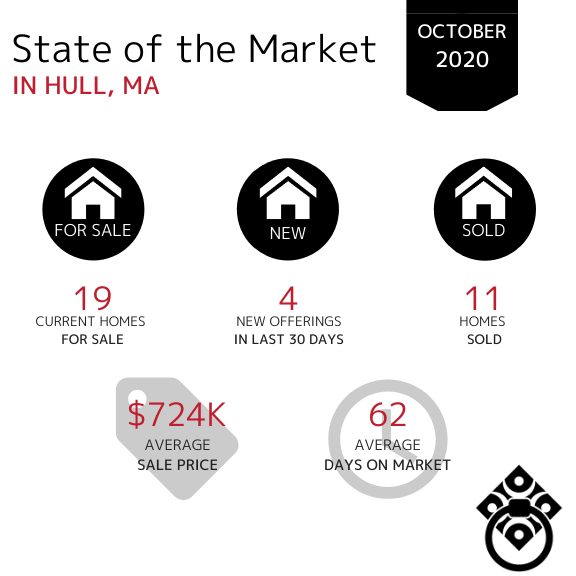
In the Town of Hull, the number of homes sold has continued to decrease from 20 in August and 13 in September. There were more homes entering into the market during the month of September however there is currently more homes for sale in the town of Hull than in September.
The Average Days on Market increased from 56 days in September. The Average Sale Price has increased by $213k.
In the Town of Bourne, the amount of available inventory has decreased month over month. The Average Days on Market has remained consistent which tells us that the buyer demand is there however the lack of inventory is hindering them buying at an even faster pace. The Average Sale Price has continued to increase from $614k in September.

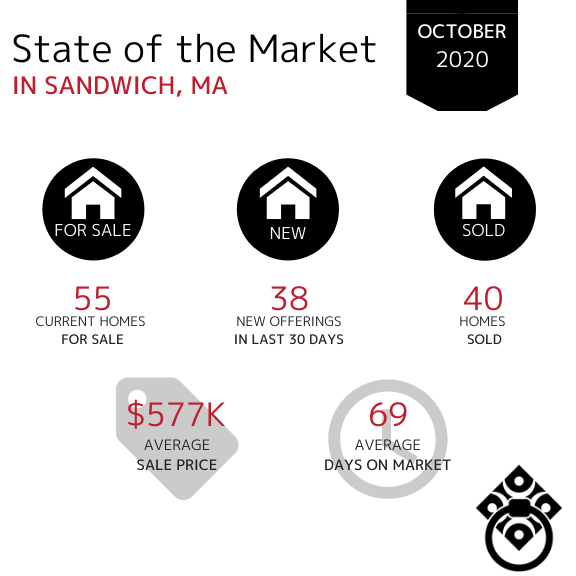
In the Town of Sandwich, the Average Days on Market significantly increased from 46 Days in September. The number of homes sold has slightly decreased however there is less inventory available on the market.
In the Town of Mashpee, the Average Sale Price has increased from $779,000 in September. The Average Days on Market have decreased drastically from 124 days in September. The number of homes sold has remained consistent since July with just a slight increase in October.

In the Town of Falmouth, the Average Sale Price has decreased for the first time since July. The number of new homes entering the market in September has remained fairly consistent which shows us that homeowners are still actively entering the market just at a slightly slower pace. The number of homes sold has increased from September.

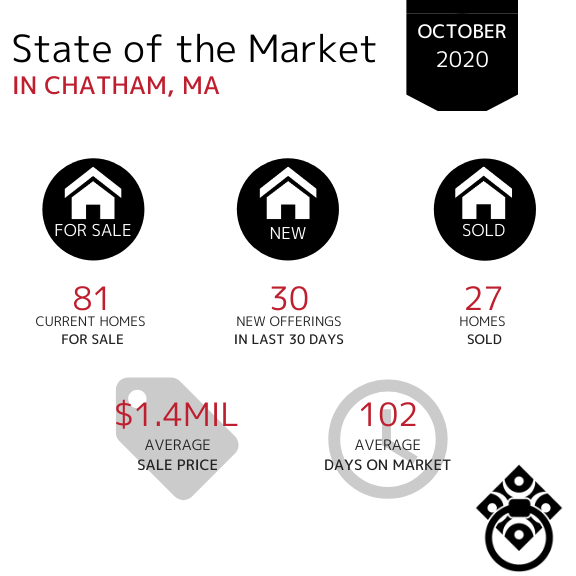
In the Town of Chatham, home sales decreased slightly during the month of October. The market in Chatham is remaining consistent with throughout the last two months. The Average Sale Price has remained in the million dollar bracket over the last 3 months. The Average Days on Market decreased slightly from 120 in September.
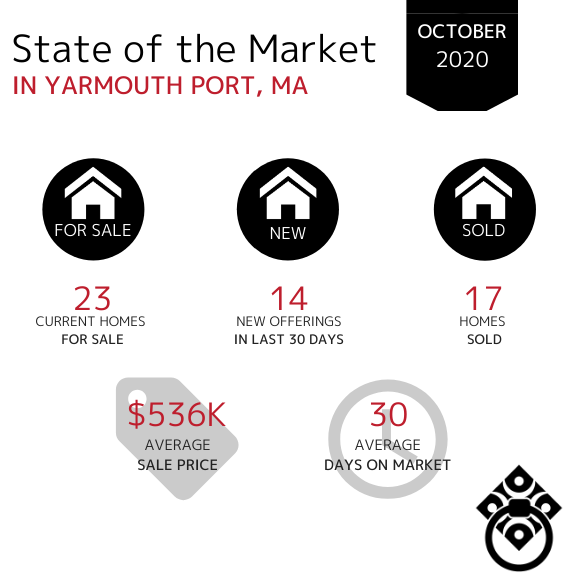
In the Town of Yarmouth Port, property sales have increased into the double digits. The Average Days on Market decreased from 72 days in September. The number of new homes and current homes for sale remain consistent month over month.
If your town wasn't included in this report,
click here and let us know. We'll be happy to get you that data!
VIRTUAL SELLING
SOLD DURING COVID-19
Looking for your Dream Home?
*Market Information obtained from MLSpin, Cape and Islands MLS and Keeping Current Matters*
Basic Text Object
Lorem ipsum dolor sit amet enim. Etiam ullamcorper. Suspendisse a pellentesque dui, non felis. Maecenas malesuada elit lectus felis, malesuada ultricies. Curabitur et ligula. Ut molestie a, ultricies porta urna. Vestibulum commodo volutpat a, convallis ac, laoreet enim. Phasellus fermentum in, dolor. Pellentesque facilisis. Nulla imperdiet sit amet magna.


