


We have continued to crunch data from the South Shore and Cape Cod Association of Realtors® Multiple Listing Services (MLS) to help our clients and community better understand the state of the local real estate market.
Last updated 10/13/20
This report is for single family homes in Plymouth County and Barnstable County. Please note Condos, Multi-family homes and land are excluded.
New Listings: New listings inventory continues to decrease vs last year. Down ???% from this time last year. In 2019 - 1,580 listings were available in Plymouth County as of 9/14/19 whereas there are only 619 homes on the market as of today. There was a decrease of 7.8% in the number of new listings in Barnstable County year-to-date.
Price Changes: It is certainly still a Sellers market. They are still not negotiating in the current market and are getting more money for their homes than they would have at this time last year. 47.58% less Seller's have adjusted their asking prices this year versus 2019. Price change data is currently unavailable for Barnstable County.
Pending Contracts: As of September 14th, there has continued to be a decrease in the number of pending sales of 0.55% from what the numbers were in 2019. However, average days on market has also decreased as demand remains high in the current market. Pending data is currently unavailable for Barnstable County.
Closed Sales: A strong start of 2020 has helped sold data remain rather unscathed throughout the hardest months of the pandemic . The market has continued to be extremely active since mid-May although there has been a further decrease in closed sales by 269 homes year over year in Plymouth County due to the lack of inventory. In Barnstable County they saw, a year-to-date increase of 11.7% more sales year over year as of October 13th shows that the market on the Upper Care is continuing to perform better this year than in 2019.
Mortgages: Mortgage rates continue to remain consistent and lower than usual with a strong real estate market. Readily available mortgage types continue to be Conventional (Fannie Mae and Freddie Mac), Government (FHA and VA with tighter FICO score requirements), USDA, Mass Housing, Renovation and Jumbo (although some lenders don't have access to some of the bank investors that are doing them). First time home buyer rates are low right now and it's a great time to take advantage!
We are here to help: We are here for you to answer any questions and help you find solutions and possibilities during these uncertain, changing times. Please do not hesitate to contact us at [email protected] or call 508-746-0033.
How is the Market performing right now?
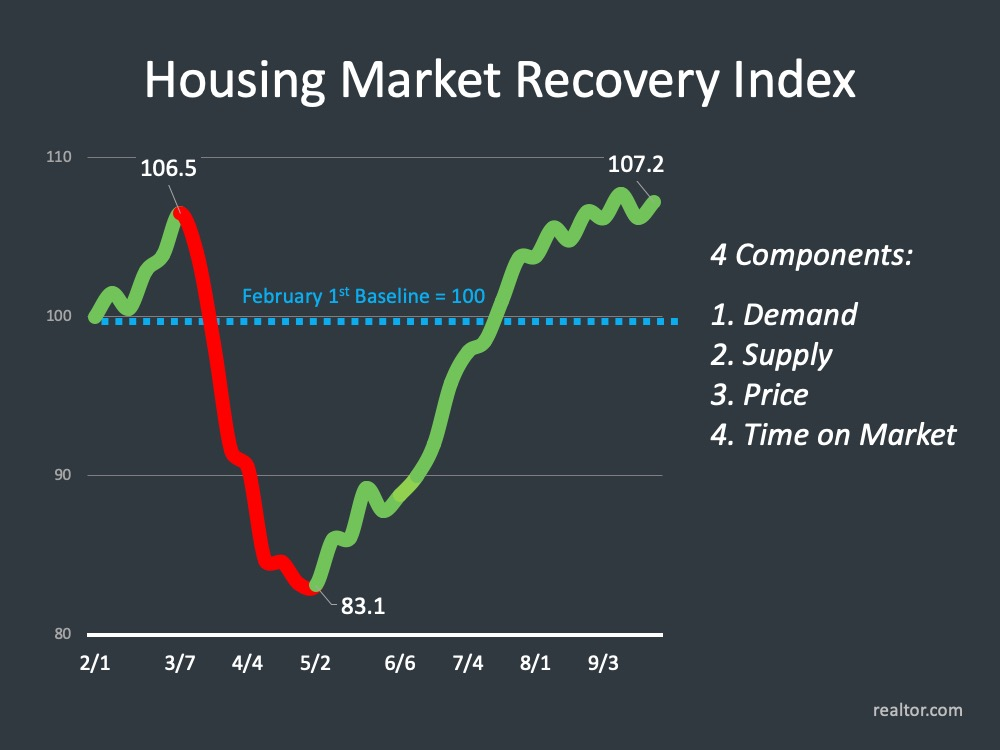
This month we'll start with a quote from Mark Fleming - as we think about where are we at in the world of real estate today in October, he says, “Housing has experienced a strong V-shaped recovery and is now exceeding pre-pandemic levels.”
If we visually look at what that is, we can go to the housing market index which we’ve been following it for the last several months. We see this dip down in
April and this kind of recovery V-shape there up to where we are today, exceeding pre-pandemic levels
looking at demand, supply, price and time on market.
So, as we look at the real estate business, we can
confidently say we have experienced a V-shaped recovery. When we look at our business, we
can say we started out this year strong, and as people were able to come out from quarantine, that momentum continued on throughout.
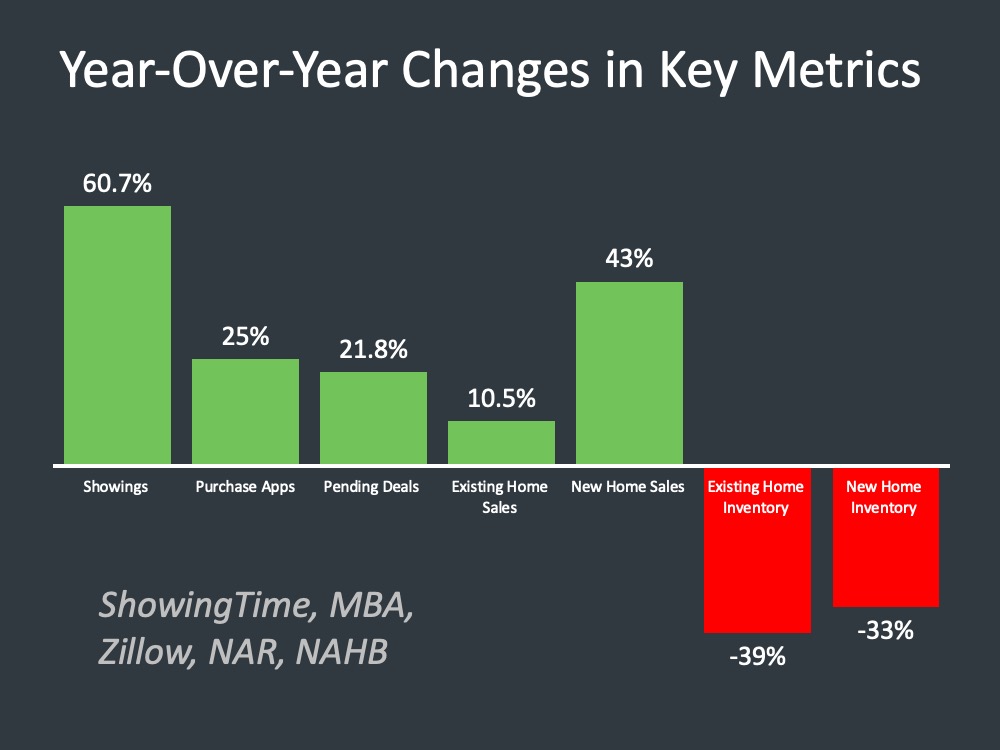
If we look at some of the key metrics relative to that recovery, our team put together this year-over-year change in key metrics. What is the market that we’ve settled into? If you remember, last time we talked about getting through some of the pent-up demand and settling into this market, and we’ve settled into quite a nice market.
If you look on the left here, showings are up across the country as tracked by ShowingTime, 60.7% on average across the country as compared to January 1st, purchase applications up 25% year over year and pending deals up 21.8%. Existing home sales and new sales home sales are up as well, so all of these indicators saying, “Hey, we’re ahead of where we were this time last year,” and even the information that we’ve reviewed really suggests we’ve worked through pent-up demand, and we’re settling into a market that is moving along quite well.
And the challenge, you see on the right side is inventory. Existing home sale inventory
and new home inventory is down - 33% for new homes and 39% for existing
homes. That is the challenge in the market, but as we look across some of these leading indicators that
we can say, there are many people out there with the idea of home and
their desire for home has changed during the pandemic. It brings up the question - can we keep this momentum up? To get a picture into that question, we’ve got to start to look at the overall economy. What do
we look like overall in the economy as the U.S.?
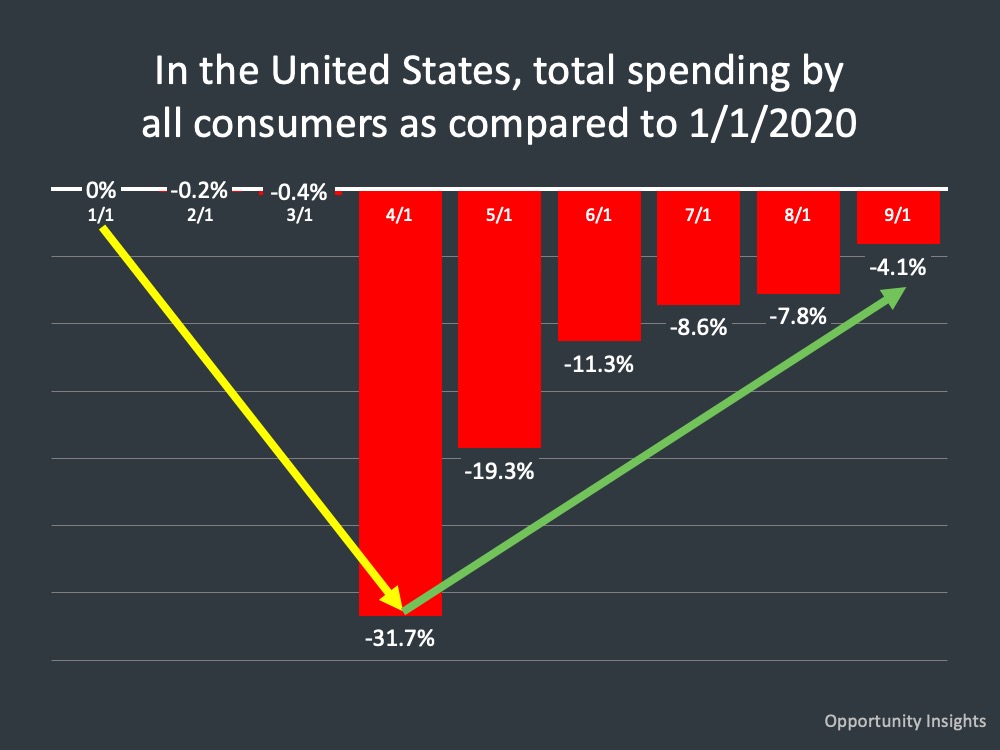
Let's start with consumer spending across
the U.S. This is measured by Opportunity Insights and it goes all the way back to the 1st of January. It
goes through September and shows we dipped down in April, down almost 32% in consumer
spending, and it kind of slowly comes back up in this even wider V-shape to where on average,
across the country, consumer spending is within 4.1% of where it was back in January. That’s an
encouraging sign. We want to see that continue to return as consumers are able to go out and purchase
goods and have certainly the income and the jobs to do that.
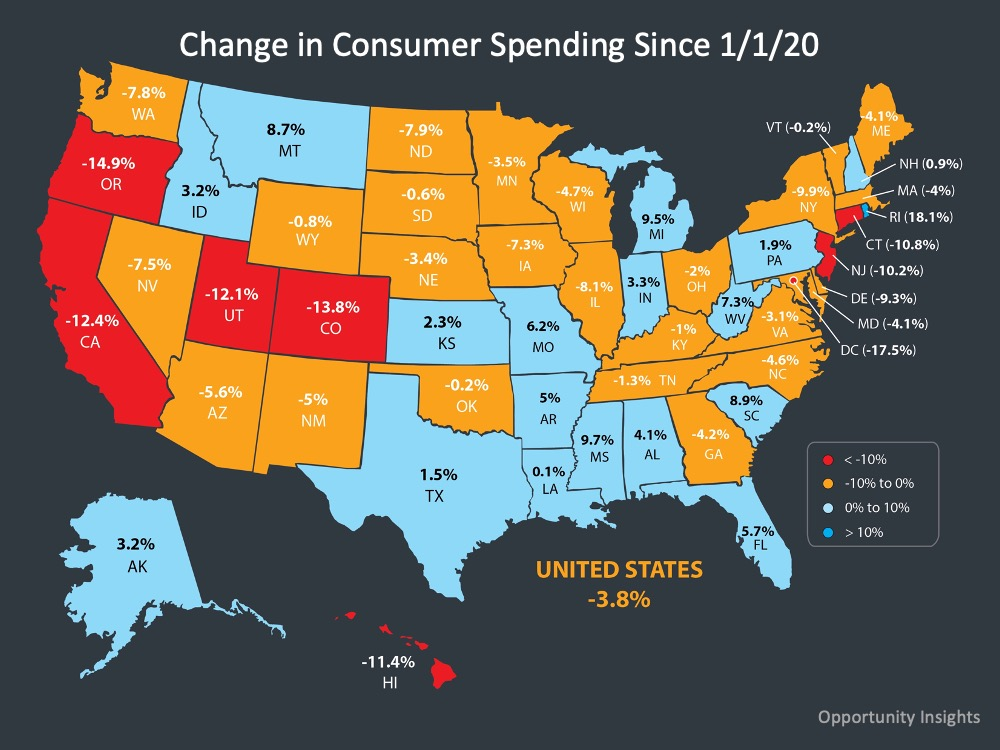
The change in consumer spending across the country you can see many states in the blue color are past or above where they were January 1st. They’re positive relative to consumer spending. Some of the orange areas you see anywhere within a percent, two percent of being back to where they were on January 1st, and some red states still lagging behind.
Certainly, areas that were heavily by coronavirus and dealing with that have impacted those economies. The economies that are based on tourism, travel, and some of the service-based industries that have been hit hard are still recovering from that.
What is happening with Inventory?
You might remember this
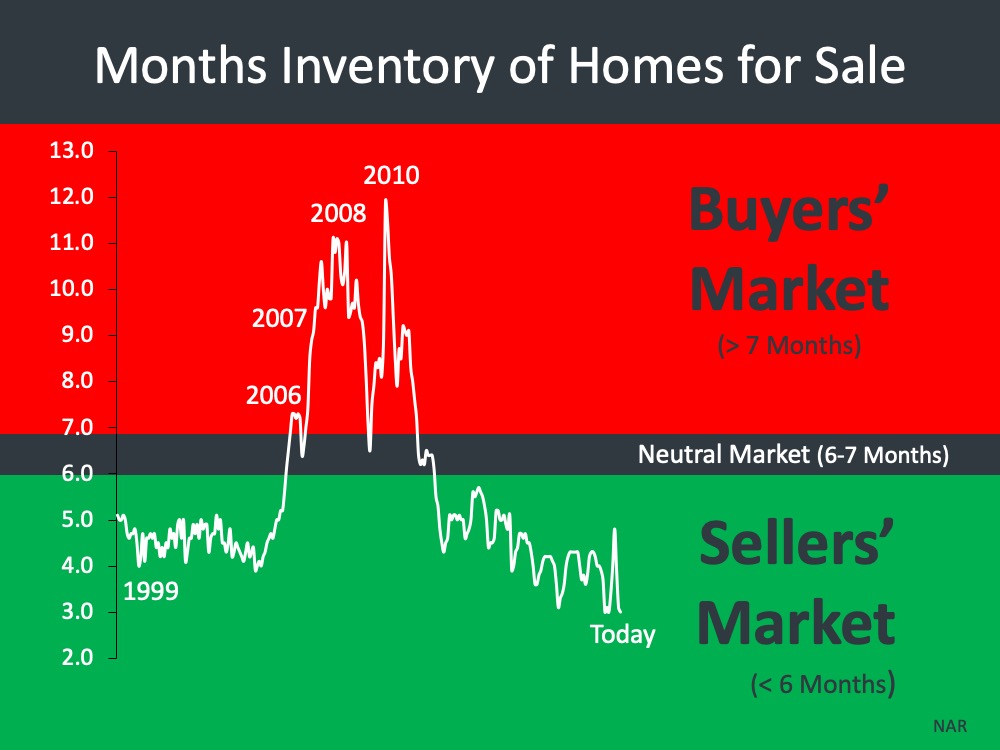
image of the difference between 2008 and the difference between today, and this is now updated with
the most current information. Today, we’re in a seller’s market whereas in 2008 we were in a
buyer’s market with an oversupply of homes on the market for the number of people
that wanted to buy them.
Back in 2008, we had depending on when you look in the timeframe anywhere from 10-12 months
of inventory on the market. Where do we sit today? We sit at historically low inventory across the
country. This graphic goes all the way back to 1999, and we’re below that in the available inventory for
the number of people that want to buy those homes, so a very different market than what we saw in 2008. When
we saw over supply back in 2008 that led to price depreciation where today, we’re in very much an
appreciating market because of the lack of supply in homes across the country.
The obstacle that could be the impediment to our growth
in housing, really the recovery, is the lack of available inventory. We’re at a severe shortage across the
country in the number of available homes for the number of people wanting them because the value of home has grown over the pandemic.
Interesting quote here on the right from realtor.com. We don’t have the inventory. We’re in an
accelerating market and so many people want a home but can’t get them, and it’s driving the price up
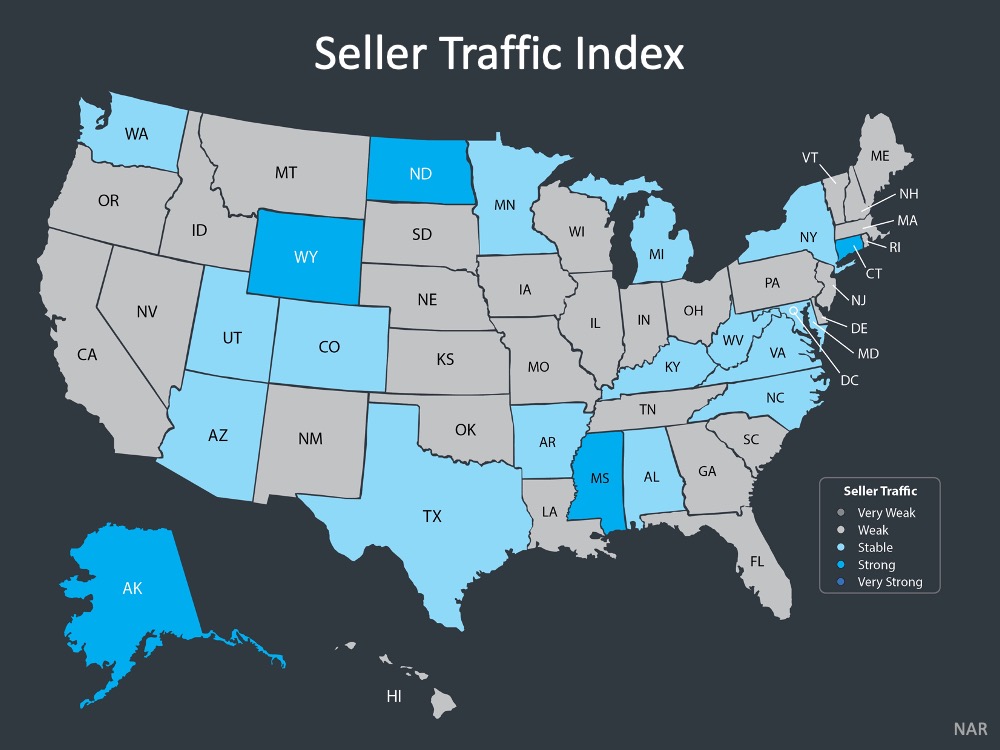
across the country. If we look as well as at NAR’s Seller Traffic
Index, we see across the country still a lot of grey, a lot of folks reluctant to put their home on the
market for a number of different reasons. Maybe they don’t have a place to go or worry about what if we
don’t have a place to go, second may not feel safe in putting their home on the market right now.

If we look as well as at NAR’s Seller Traffic Index, we see across the country there is still a lot of grey. Many homeowners are reluctant to put their home on the market for a number of different reasons. Maybe they don’t have a place to go or worry about what if we don’t have a place to go or they may not feel safe in putting their home on the market right now.
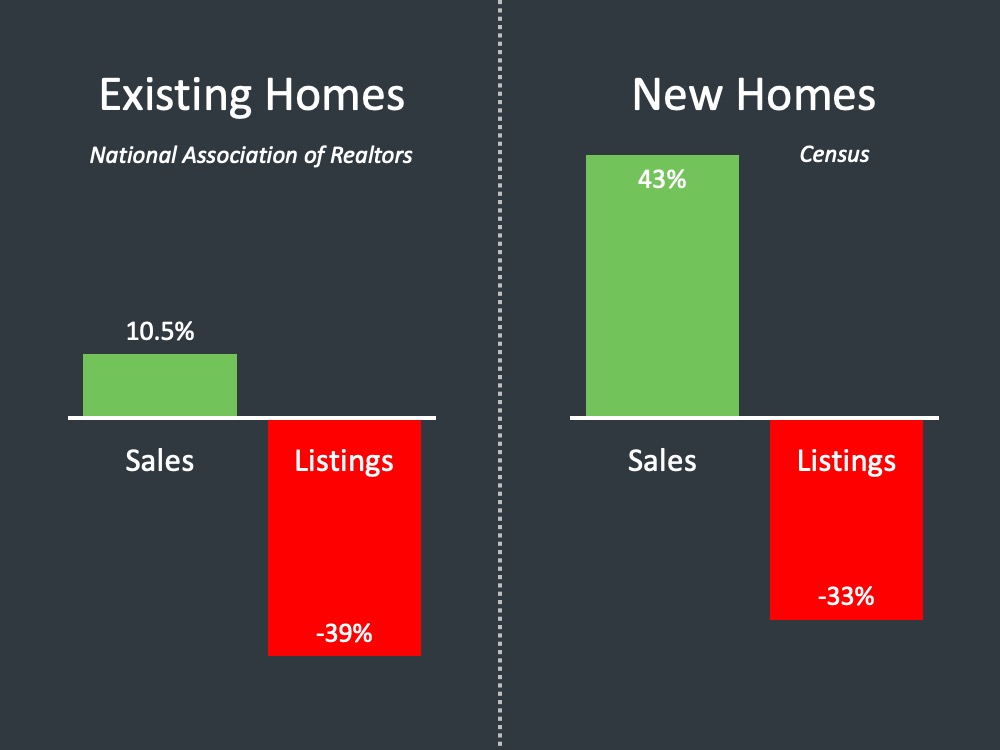
A very interesting
picture of this challenge here in existing home sales and new home sales from NAR and from the Census. If
we look at existing home sales being up 10.5% and listings down 39%, so we have more
sales than we have literally inventory coming into the market creating this challenge. Same thing in new home, but a much more drastic jump in the sale of new homes, 43% growth in new home sales and
yet, listings are down cumulatively 33%.
So, again this delta forming between the number of people that are buying and the number of available
homes for them to buy causing this challenge. More people are buying and there are less available homes there for those that want to purchase.
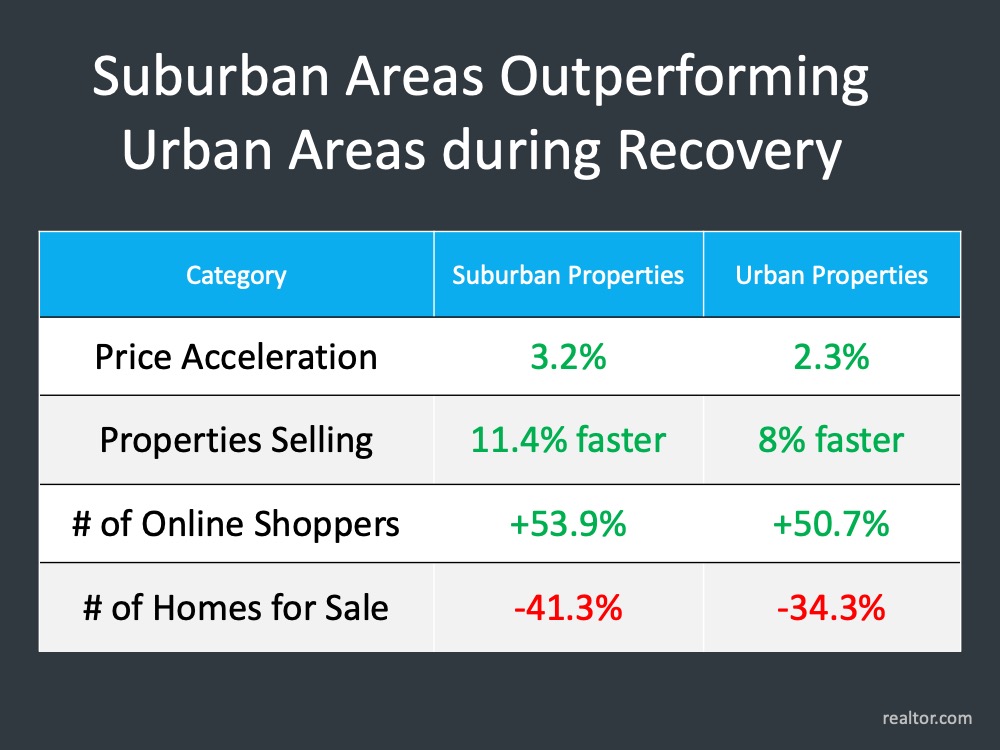
Certainly, suburban areas are outperforming urban areas in the recovery. You can see it here, but not a tremendous difference in numbers, price acceleration faster in the suburban area vs. urban areas. Properties are selling faster in suburban areas vs. urban areas.
You can see the deficiency in the number of homes for sale is more in
the suburban area due to demand, but this helps you gain perspective on the performance of both of
those areas There are likely still folks saying "We want to be in a less dense environment right
now. We have different needs that we are desiring for our living space, whether it be our family,
individually. I need more space, more backyard, all those types of things, work from home, and so on.”
LET'S TAKE A CLOSER LOOK AT HOW YOUR TOWN DID IN THE MONTH OF SEPTEMBER ⤵️
In the Town of Plymouth, home sales have increased in the month of September from 85 in August. The number of Average Days on Market has risen for the first time in 3 months.
Homes entering the market have slowed down as the frenzy of summer came to an end.

In the Town of Hingham, the number of new homes entering the market has increased by more than 50% from August. Homes continued to sell fast just as they did in August vs. July however they spent approximately an extra week or so on the market. The Average Sale Price remains in the million dollar bracket month over month.

In the Town of Scituate, the Average Sale Price increased by over $100,000 in September. Home sales have increased since August and they're spending the same amount of time on the market. The number of new offerings has continued to decrease which tells us that the market in the town of Scituate is remaining but at a much slower pace than neighboring towns.

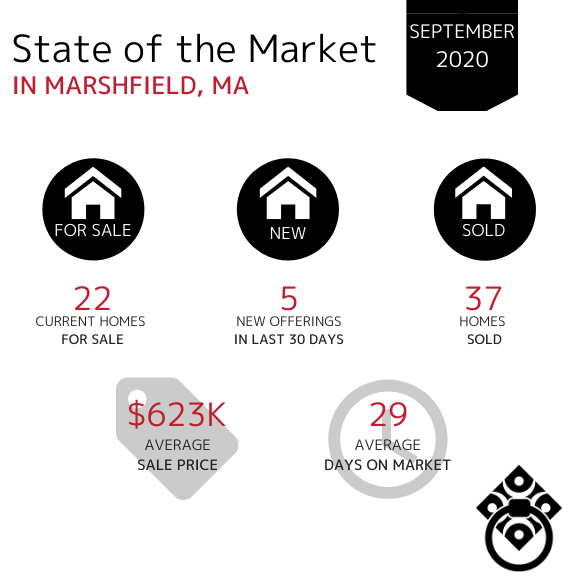
In the Town of Marshfield, the number of homes sold during the month of September decreased from 42 in August. Properties are selling at a much faster pace - spending less than a month on the market.
In the Town of Kingston, the number of new homes for sale has remained consistent with only a very slight increase since August. The number of homes sold decreased which shows us that there was less available inventory even though buyers are still actively purchasing homes. The Average Days on Market increased from 31 in August back to the near mid-50s as they were in July and the Average Sale price decreased as well from $516k in August.

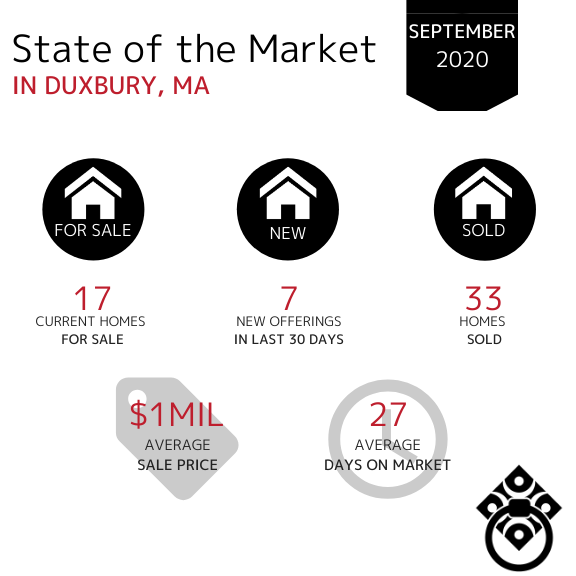
In the Town of Duxbury, the Average Sale Price of homes remained in the million dollar bracket since August. Available inventory has remained the same month over month and the Average Days on Market have decreased by more than half in September.
In the Town of Norwell, the average days on market have dropped in the month of September. There has been a consist amount of inventory from April through September. The number of homes sold in Norwell in the month of September was slightly lower than in August but has remained fairly consistent. The Average Sale Price has decreased just under $1M in August.

In the Town of Cohasset, the amount of available inventory has decreased as we ended the month of September and entered into October. The number of days on market has increased again from 44 in August. The Average Sale Price remains in the million dollar bracket at $1.5M.

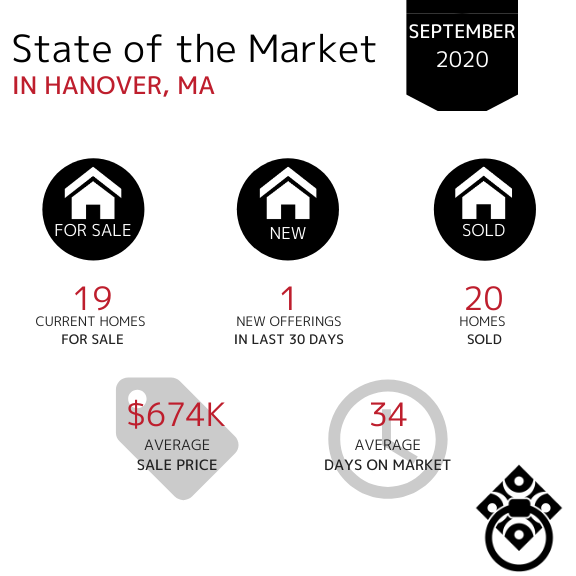
In the Town of Hanover, the number of homes sold has remained fairly consistent. The Average Days on Market has decreased from 43 in August to just about 1 month. The Average Sale price has increased again by more than $30,000.
In the Town of Pembroke, the amount of new offerings in the last 30 days have increased however the total amount of homes for sale has remained consistent which indicates that homes are still selling and entering the market simultaneously. The Average Days on Market decreased again from 49 days in August. The Average Sale Price has increased from the mid-high $400,000s over the last five months to $528k in September.

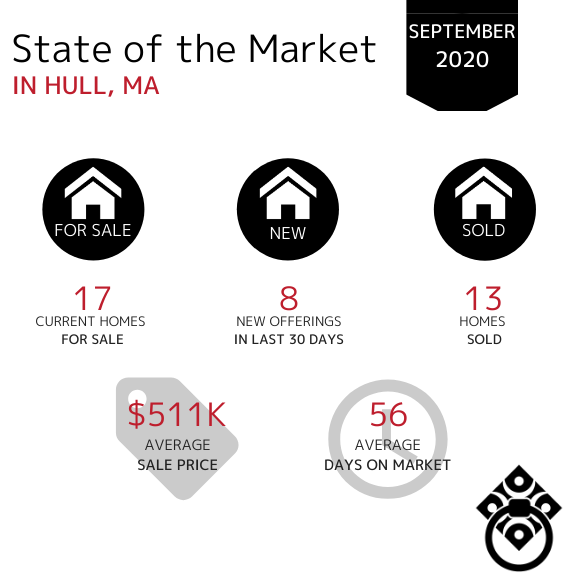
In the Town of Hull, the number of homes sold has continued to decrease from 20 in August to 13 in September. There were more homes entering into the market during the month of August than there was in September and the Average Days on Market increased from just over 2 months to 56 days in September. The Average Sale Price has decreased from $707K in August.
In the Town of Bourne, the amount of available inventory has increased slightly in September. The Average Days on Market decreased from 71 in August. Once again, this tells us that the buyer demand is there however the lack of inventory is hindering them buying at an even faster pace. The Average Sale Price has continued to increase from $593K in July.

In the Town of Sandwich, the Average Days on Market significantly decreased from 69 Days in August to just about a month and a half in September. The number of homes sold has increased showing a strong market in Sandwich. The amount of new inventory in the last 30 days has remained consistent over the last 5 months!

In the Town of Mashpee, the Average Sale Price has declined from $835,000 in August. The Average Days on Market have increased drastically from 84 in August to 124 in September. The number of homes sold has remained consistent since July.

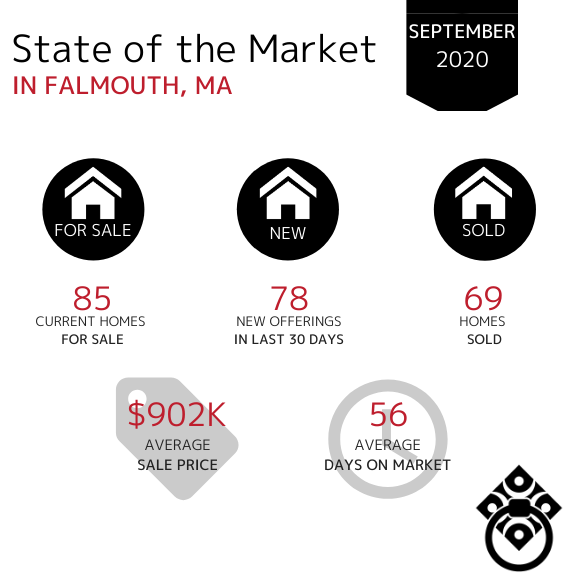
In the Town of Falmouth, the Average Sale Price has continued to increase month-over-month since July. The number of new homes entering the market in September has remained consistent which shows us that homeowners are still actively entering the market as we entered into Fall. The number of homes sold has remained consistent as well throughout the last 3 months.
In the Town of Chatham, home sales increased slightly during the month of September. The market in Chatham is remaining consistent with throughout the start of the Fall. The Average Sale Price has remained in the million dollar bracket over the last 2 months. The Average Days on Market decreased slightly from 142 in August vs. 120 days in September.

In the Town of Yarmouth Port, property sales have continued to decrease slightly from 15 homes sold in August. The Average Days on Market remain fairly consistent with only a slight drop. The number of new offers and current homes for sale remain consistent as well.

If your town wasn't included in this report,
click here and let us know. We'll be happy to get you that data!
VIRTUAL SELLING
SOLD DURING COVID-19
Looking for your Dream Home?
*Market Information obtained from MLSpin, Cape and Islands MLS and Keeping Current Matters*


