


Each month we crunch data from the South Shore and Cape Cod Association of Realtors® Multiple Listing Services (MLS) to help our clients and community better understand the state of the local real estate market as we continue through the first half of 2021.
This report is for single family homes in Plymouth County and Barnstable County. Please note Condos, Multi-family homes and land are excluded.
New Listings: New listings inventory continues to remain down by 58% from this time last year. In 2020 - 928 listings were available in Plymouth County as of 6/10/21 whereas there are only 414 homes on the market as of today. There was a decrease of 8.62% in the number of new listings in Barnstable County as compared to 2020.
Price Changes: It continues to be a Sellers market due to limited inventory throughout Plymouth County. Sellers are still not in a market where they need to be negotiating and they're are getting more money for their homes than they would have at this time last year. 158 homes changed their prices last year vs. 375 YTD. Price change data is currently unavailable for Barnstable County.
Pending Contracts: As of June 10th, there are 52 more homes under contract vs. 2020. The average days on market has continued to decrease as demand remains high in the current market. Pending data is currently unavailable for Barnstable County.
Closed Sales: The market has continued to be extremely active even with limited inventory. That has not stopped as we continue through the second quarter of 2021. There was only a variance of negative 29 units in 2021 vs. 2020. The number of listings sold in Barnstable County is up 19% as of 6/10/21.
Mortgages: Mortgage rates have leveled out and are remaining consistent week over week. Readily available mortgage types continue to be Conventional (Fannie Mae and Freddie Mac), Government (FHA and VA with tighter FICO score requirements), USDA, Mass Housing, Renovation and Jumbo (although some lenders don't have access to some of the bank investors that are doing them). First time home buyer rates remain low right now and many are finding that they are qualifying for Conventional Loans setting them at a better advantage for winning offers.
We are here to help: We are here for you to answer any questions and help you find solutions and possibilities during this insanely busy market that we are experiencing. Please do not hesitate to contact us at [email protected] or call 508-746-0033.
Inventory
So much happening across the country in real estate right now, but the biggest story certainly is the lack
of available inventory causing this market – they call it here “robust demand, intense competition.”
We’re seeing bidding wars. All the things that we know are happening right now in the real estate market.
Why is that happening?
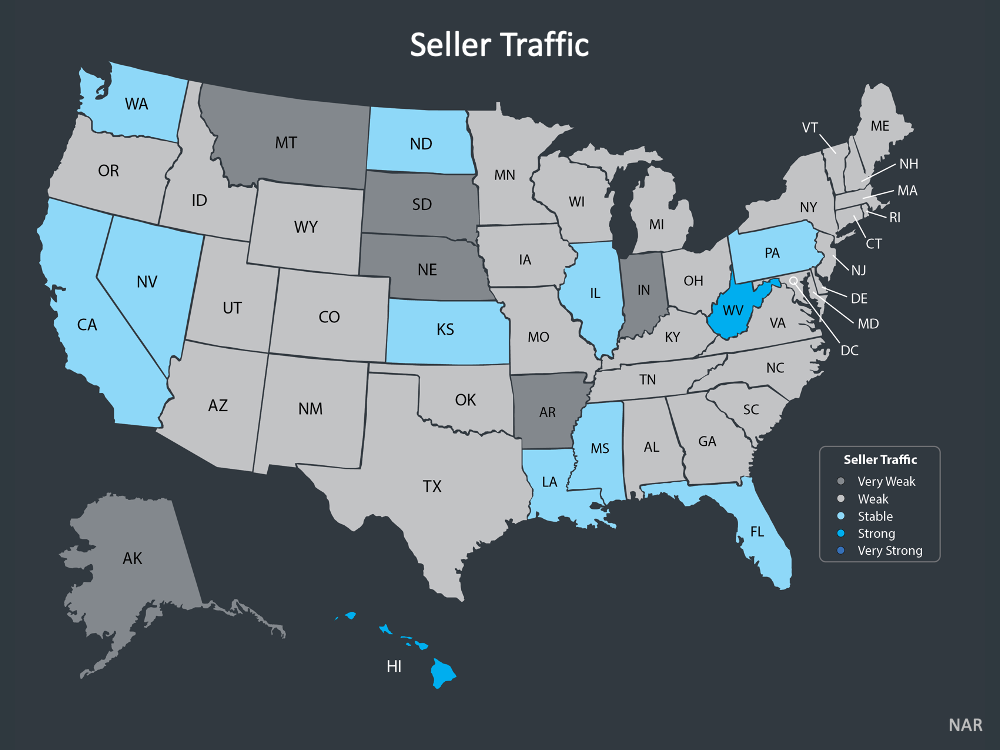
First reason, is we don’t have the sellers that we need in the market
today. This graphic here from NAR shows seller traffic. Think about those that are putting
their homes on the market. In this gray – darker gray – is the very weak seller traffic. Moving to blue. And then dark blue in no
case. There may be a little bit darker blue. Stronger seller traffic in one state. In West Virginia you can
see it there, but the majority of the country, weak to very weak seller traffic.
Read more HERE.
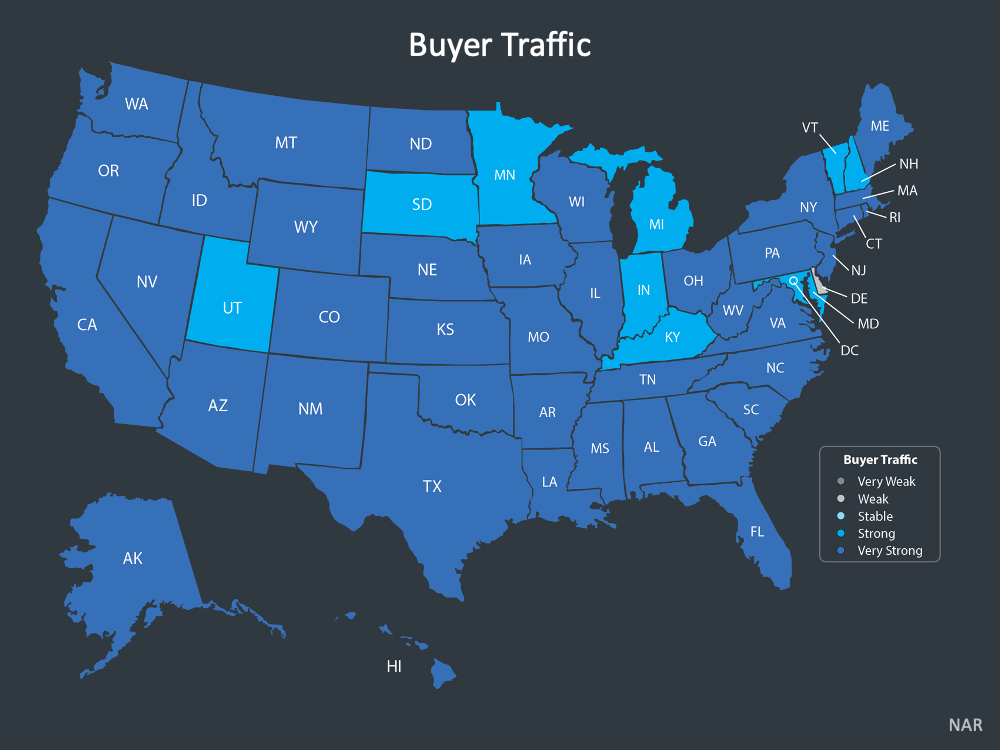
Now,
let’s contrast that just visually with buyer demand or buyer traffic. And what do you see? We have
strong to very strong buyer traffic across the country.
So very weak seller traffic. Very strong buyer traffic.
This is something that you already know, but
this really underscores the reality across the country no matter where you’re at. That largely we’re
seeing less sellers and more buyers in every area of the country.
Realtor.com used this. This wild, wild west environment. Buyers are
doing anything they can to stand out and more and more all cash offers do just that. There can be the
difference between getting that dream home or winding up empty handed again.
The buyer fatigue. The buyers that are frustrated right now that they
can’t find home or have been outbid or whatever the case may be. Their offer maybe declined because
of an all cash offer.
If we look at inventory, we know across the country we’re in this situation because inventory has been depleted as we went through last year. We saw this low in December, in January of this past year. To where now – April the most recent number reported by NAR – 2.4 months on average of inventory available. Inventory across the country. We want to see that number continue to rise. Those that are in the buying process. Setting that expectation that we’re in this situation because of the lack of inventory. Now, we’ve talked in past monthly market reports about the reason for the lack of inventory. If you go back and look at prior monthly market reports that underscore the lack of construction that has put us into this situation right now. But what does all this mean? What does mean for those that are buying? The price is going up. We have more buying than that are selling. And we know price is going up. The March year over year home price appreciation numbers have just come out – FHFA – 13.9% CoreLogic, 11.3% Case-Shiller, 13.2% - if you remember last year this number was right around 10% in the calendar year. Year over year we’re still seeing hot appreciation under the market. And forecasters saying, “You know what? Appreciation is going to continue.
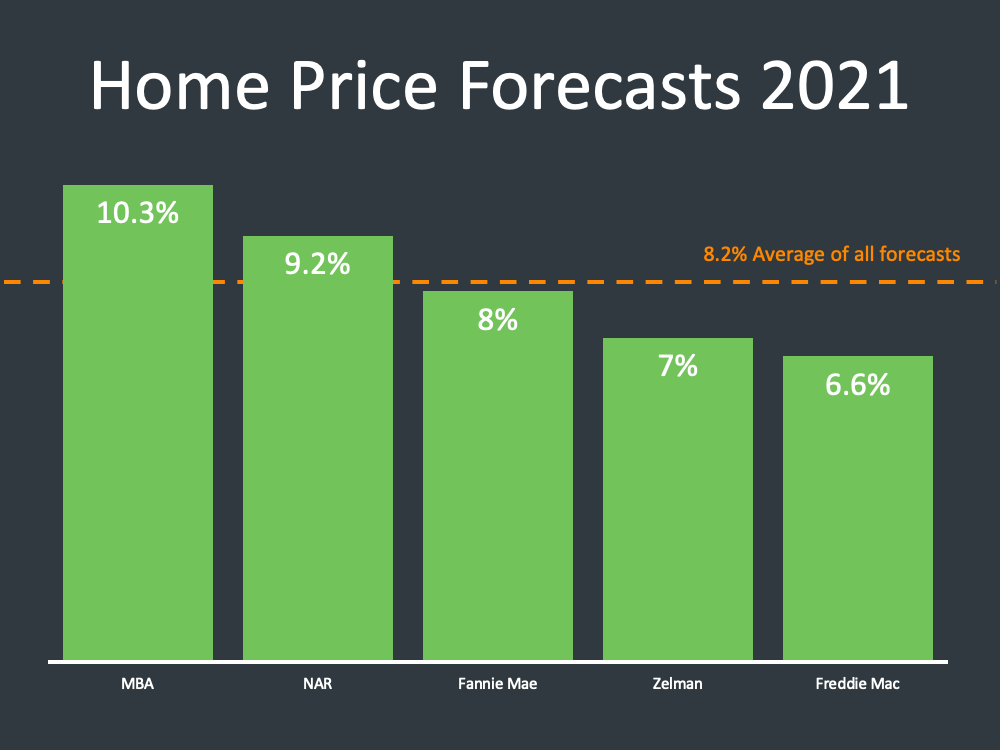
Now, for the last several Monthly Market Reports, we’ve talked about forecasts.
What are
forecasters saying? I’ve got an update for that, but suffice it say, in the rearview mirror, we’ve seen
strong and are seeing strong appreciation right now. As we look forward, we’re forecasted to see
strong appreciation. This is the latest look.
Now, we went down from seven to five forecasters in this case for a couple of reasons. One, these are
forecasters that are forecasting home price appreciation in 2021. The other two forecast for the next 12
months. This gives us a little bit more of an apples to apples approach, but also, the one thing that these
five have in common is each one of them have upped their forecast as the year has gone on.
We’re here in June and we started out in January. It’s come up several points since then. The
average right now – 8.2% appreciation by forecasters in the 2021 real estate market. Now what’s that
going to depend upon as we go throughout the year?
Demand and supply.
We know demand is there and we’re wondering, is supply coming back?
We’ve talked about that. But that will be the ultimate determiner of price as we go forward. But what
you see experts clearly saying here is we’re going to have a strong price appreciation this year as we go
throughout, and that’s just – again. Not in one area of the country.
Housing Affordability
So homes being very affordable. We look back over time. Those that are in the
hunt right now trying to buy a home. And maybe you’ve gotten outbid or whatever the case may be. Getting frustrated or fatigued in their pursuit of buying a home.
Here’s what I would remind them of. Homes are affordable, and as opposed to renting, the options are
still very, very good.
Michael Laughlin said this from the Urban Institute. “Contrary to popular belief,
owing one’s home is frequently more affordable than renting. It is cheaper to buy a home than it is to
rent in two out of three of American counties.” 5 of 7
So it’s more affordable to buy a home than it is to rent.
We know all the benefits of home ownership.
We’ve talked about that. June’s the National Home Ownership month. I’m going to talk about that in
just a minute, and what’s happening with the price of rent? It continues to go up. This is a look going all
the way back to 1990. Rent continues to go up.
Renters do not see the benefit that homeowners do.
Whether it be through the power of a refinance. Whether it be through all the intangible or non-financial
benefits homeownership that we know.We need to be vocal about that right now. Michael Laughlin also in that report said that.
“We need to stop seeing housing as a reward for financial success and instead see it as a
critical tool that can facilitate financial success. Affordable home ownership is not the capstone of
economic wellbeing. It is the cornerstone.” and certainly we know across the country the business that
we’re in – all the stories that we know of folks that have used equity in their homes have used the
appreciation in their homes to start a business, to send a child to college, whatever the case may be in
using their home to do that.
“Many find it hard to believe, but housing is actually undervalued in most markets.
And the gap between house buying power and sales prices indicates there’s room for further house price
growth in the months to come.” So what’s he saying? There’s room for homes to go up in price. As they measure affordability, house buying and houses are actually undervalued in most markets.
Not something we’re hearing a lot out there. But when you start to look at the numbers, that’s very
apparent.
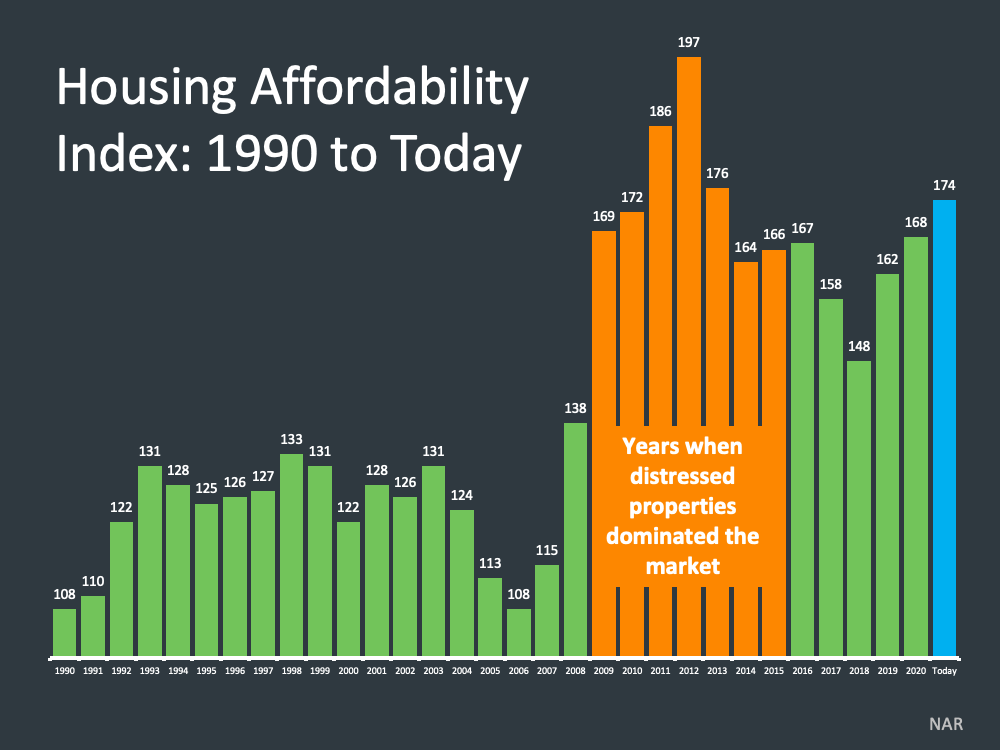
Now, how we’ve always looked at this – I keep in current matters, and bridge builders is – looking at
Housing Affordability Index. If we look at the housing affordability index – that’s produced
by NAR – you can see where we stand today. Now, if you haven’t seen this, the higher the index is the
more affordable a home is. And where do we stand today? We stand in a very, very good position. Homes being more affordable almost going all the way back to 2012, 2013 in what the dollar will
buy.
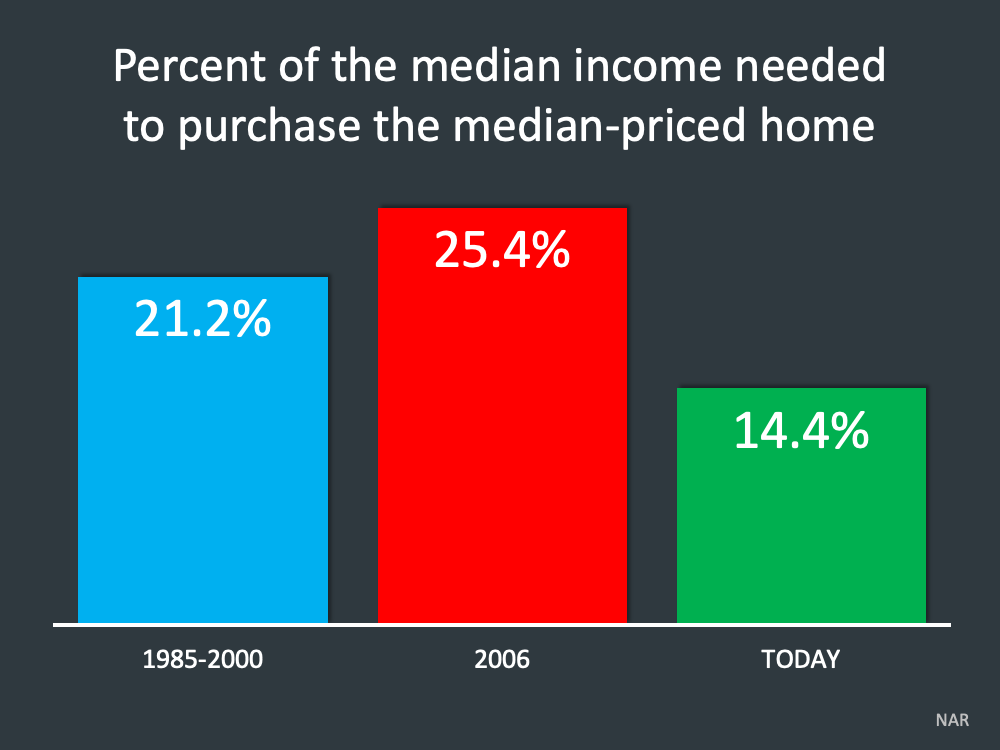
Now what stands out are the area in the middle there - where for the years were distressed properties dominated the market after the housing crash. But very, very good affordability relative to what the dollar will buy. If you want to look at that visually, the percentage of median income needed to purchase a median price home historically is about 21.2%. Back in the housing crash that rose to about 25.4%, and today we sit at 14.4% on average. The median income needed to purchase the median priced home.
Top Financial Institutions Advice
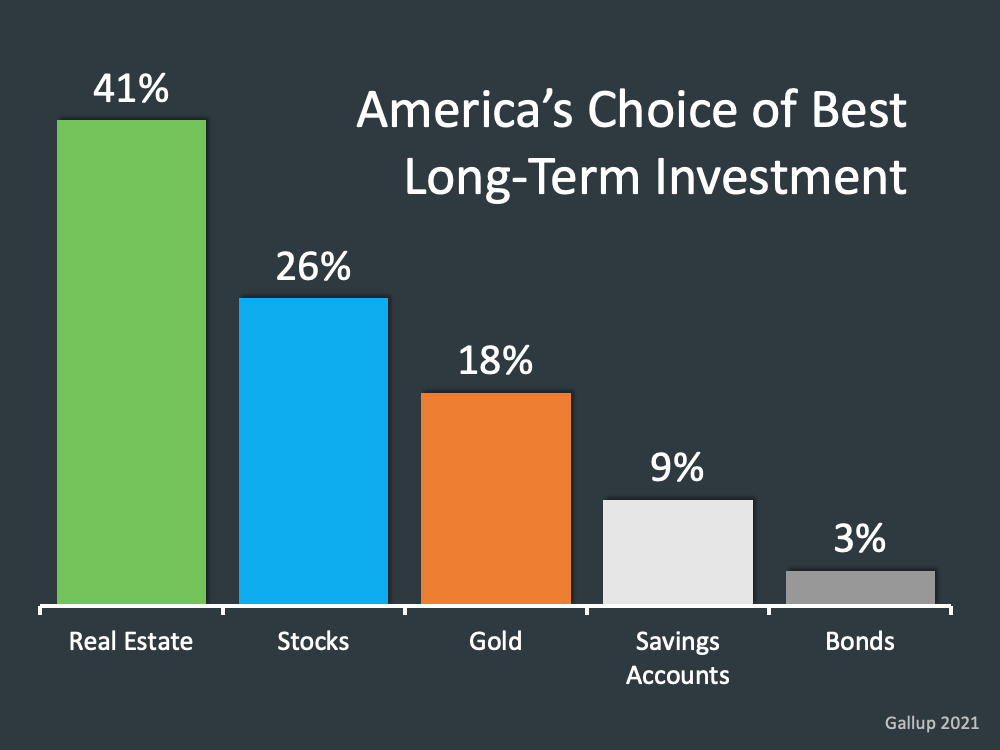
The ability to build equity. All the non-financial benefits that we know. The Gallop survey has come out. And Americans’ choice of best of long-term investment has been real estate. This 41% far outproducing stocks. In Gallup’s poll, the 41% choosing real estate is the highest selecting of any of the five investments options in the 11 years past that Gallup’s asked this question.
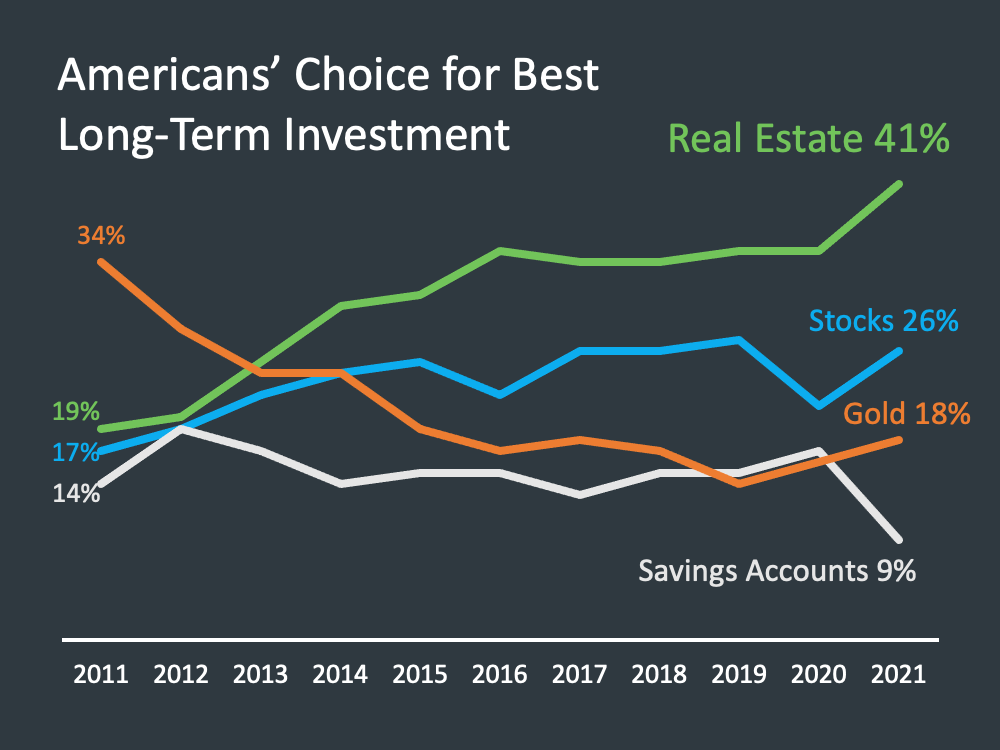
So important to remember – remember that graphically you can just see just how high that is with Americans choice for the best long term investment being real estate going all the way back to 2011. Coming out of the last downturn in 2008 and 2009, we saw folks kind of say, “Is buying a home what we want to do?” And whereas we sit we sit today, people saying, “You know what? The demand – the folks that want to buy a home like we just talked about – is at an all-time high. Very, very different in two different – you know one being a pandemic. One being a housing crash. Different scenarios. I’m not saying they were the scenarios. But both crises – coming out of this crisis we’re seeing a very, very different opinion, approach and desire towards real estate.
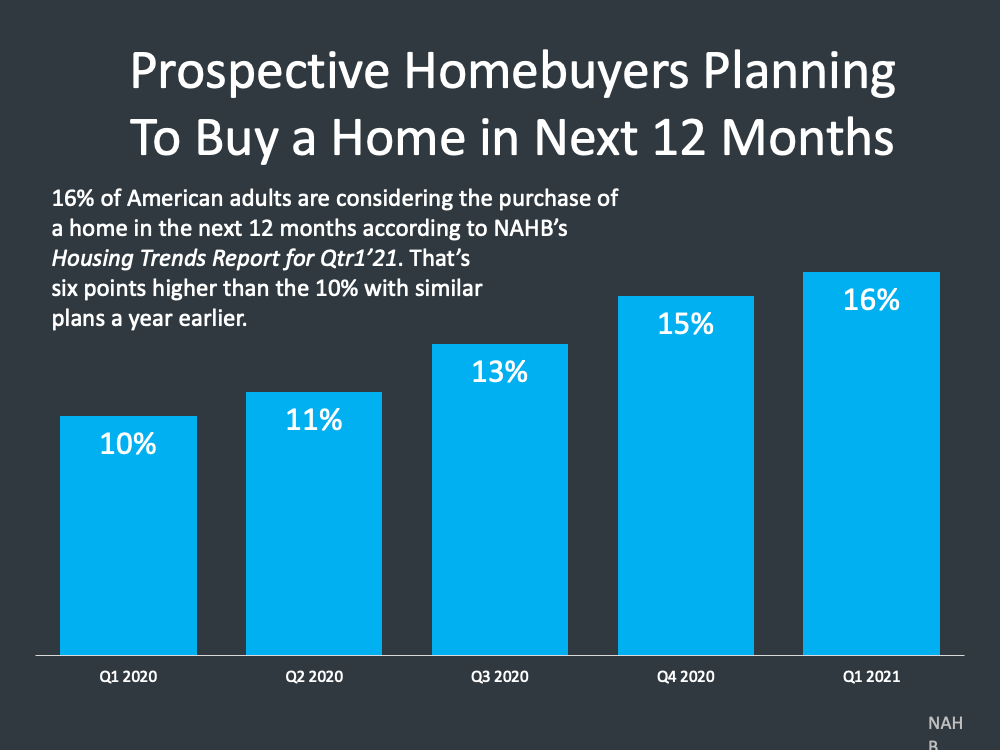
What are your Biggest Concerns in 2021?
LET'S TAKE A CLOSER LOOK AT HOW YOUR TOWN DID IN APRIL OF 2021 ⤵️
In the Town of Plymouth, home sales have increased through the month of April from 36 homes sold in April. The Average Days on Market remained relatively steady at less than one months time. The the Average Sale Price has been steady around 500k the last two months. We are seeing more homes on the market in May as the current homes for sale has decreased by 7 in April.

In the Town of Hingham, the number of new homes entering the market has remained somewhat consistent although has increased in the month of May. The Average Sale Price has remained in the million dollar bracket but increased .4k more since April. More homes sold in the month of May than they did in April bringing number of homes sold over what they were at in February .

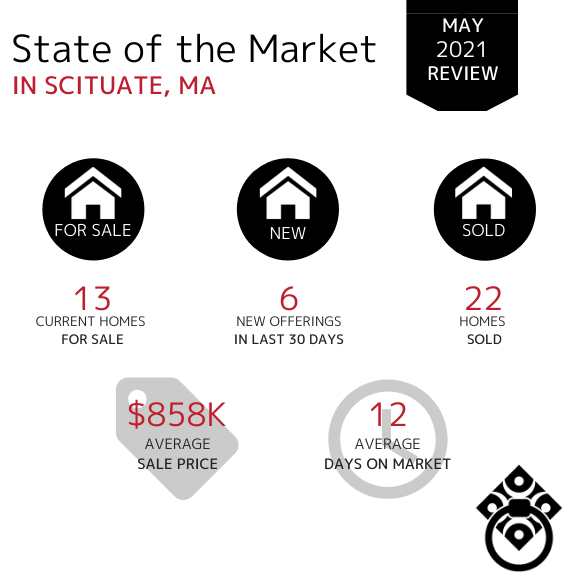
In the Town of Scituate, the Average Sale Price has increased by 100k although with less offerings in the last 30 days. Home sales have stayed relatively the same month over month as well as less days on the market for the month of April.
In the Town of Marshfield, the number of homes sold remained consistent from January through May. Properties spent much less time on the market staying under 10 days. The Average Sales Price has increased to $706K compared to March $575K.

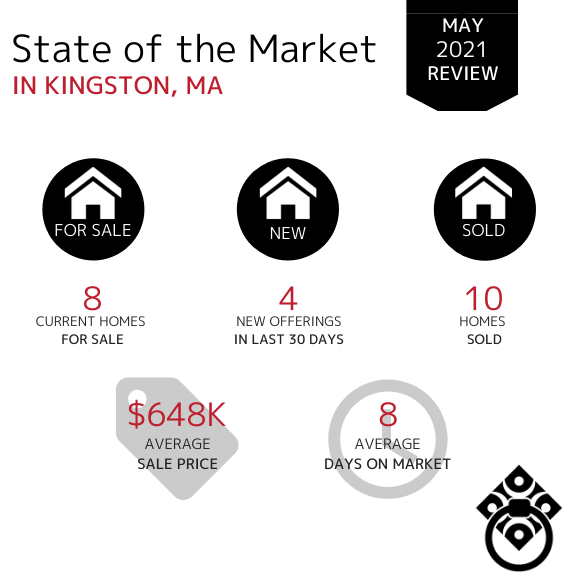
In the Town of Kingston, the number of new offerings has increased slightly over the last three months. The number of homes sold has increased since the month of April. The Average Sale Price has continued to stay relevantly in the high $500K to the mid-$600K range while spending significantly less time on the market.
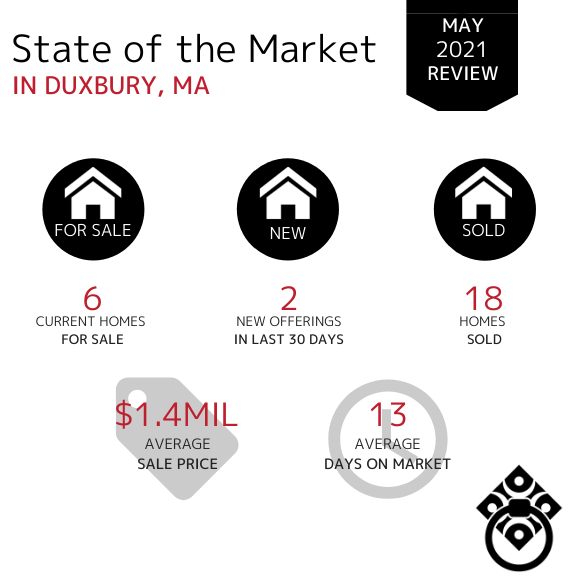
In the Town of Duxbury, the Average Sale Price of homes has increased once again into the million dollar bracket in April and May. Available inventory has remained consistent along with the number of new offerings in the last 30 days. This tells us that Sellers are continuing to enter the market as we head further into Q2. The Average Days on Market decreased slightly but has remained around 10-15.
In the Town of Norwell, the Average Days on Market have significantly improved to 13 days compared to March which was 36 days. There is limited inventory in many towns, including Norwell however, the number remains fairly consistent month over month with only slight fluctuations. The Average Sale Price although has increased from $782K in April to $928K In May.

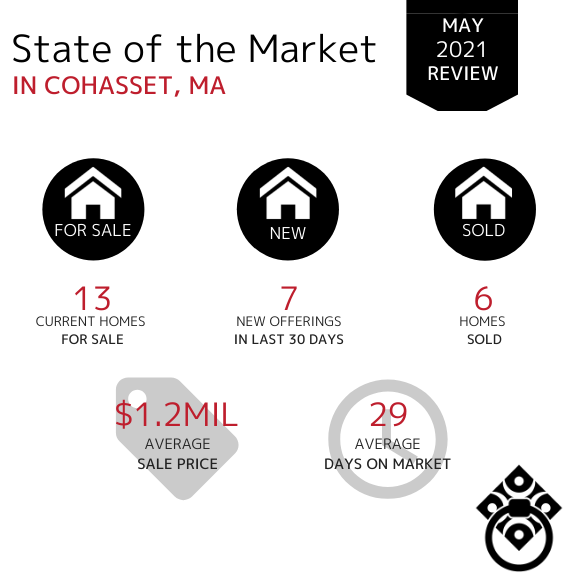
In the Town of Cohasset, the amount of available inventory has remained consistent over the last six months which shows a steady market. The number of days on market has decreased once again to just under 30 days. The Average Sale Price decreased stayed around $1MIL.
In the Town of Hanover, the number of homes sold increased from 7 in April. The Average Days on Market has decreased significantly from 76 days in April to 8 days in May. The average sales price has stayed within the $600K range.

In the Town of Pembroke, the current amount of available inventory continues to be under 10. There have been only 5 offerings within the last 30 days which could likely be attributed to the overall lack in available inventory. Sellers seem as though they are simply not ready to place their homes on the market in Pembroke. The Average Days on Market decreased significantly from 43 in April to 10 in May. The Average Sale Price has stayed relatively in the mid-$500K.

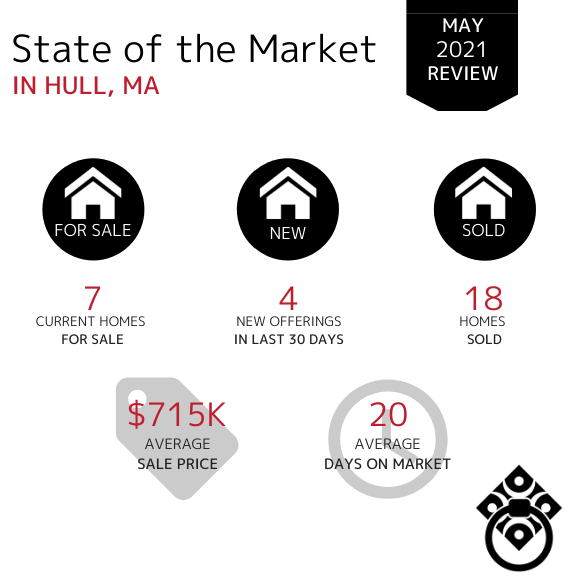
In the Town of Hull, the number of homes sold has increased increased by 7 since April. Homes entering the market have remained consistent and there is still a very limited amount of available inventory.
The Average Days on Market have dramatically decreased from 58 days in February to 10 days in May. The Average Sale Price has increased from $499k in February to over $600k last month to $715K this month.
In the Town of Bourne, the amount of available inventory has leveled off and remains consistent month over month but has increased by 8 for May. The Average Days on Market has decreased significantly from 58 days in March, which shows us that while the buyer demand is strong, there are simply not enough homes available. The average sale price has decreased from $1MIL to the high $400K range.

In the Town of Sandwich, the Average Days on Market decreased significantly while the number of homes sold remained fairly consistent. Currently there are 24 homes for sale compared to last months 15 meaning the inventory has stayed relatively the same.

In the Town of Mashpee, the Average Sale Price decreased from $1.2M in February back to where it was at in January. The Average Days on Market have decreased significantly compared to March of 111 days. The number of homes sold has remained consistent month over month but has increased by 6 since the month of April.

In the Town of Falmouth, the Average Sale Price has decreased from $986K in April. With limited inventory in most towns, there are still a good amount of new homes entering the market as we moved through the month of May although resulting in a decrease the past month. The number of homes sold has increased from the 30's.

In the Town of Chatham, current homes for sale has increased from 20 homes in March. The Average Sale Price has remained in the million dollar bracket over the last seven months. Average days on market has significantly decreased from 100 days in April to 6 days in May.

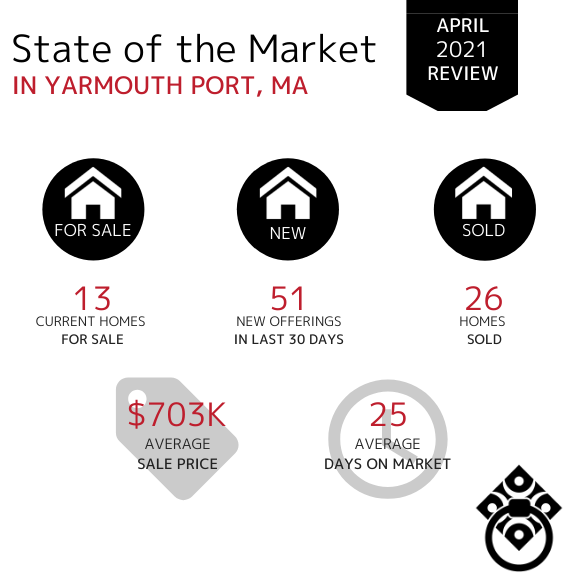
In the Town of Yarmouth Port, inventory has decreased since the month of April compared to April's 51 new offerings. The Average Days on Market has decreased significantly to 6 days compared to April which was 25 days. The average sale price had decreased along with the inventory.
If your town wasn't included in this report,
click here and let us know. We'll be happy to get you that data!
Learn How Much Equity Your Home Has Gained...
VIRTUAL SELLING
SEARCH FOR HOMES
*Market Information obtained from MLSpin, Cape and Islands MLS and Keeping Current Matters*


